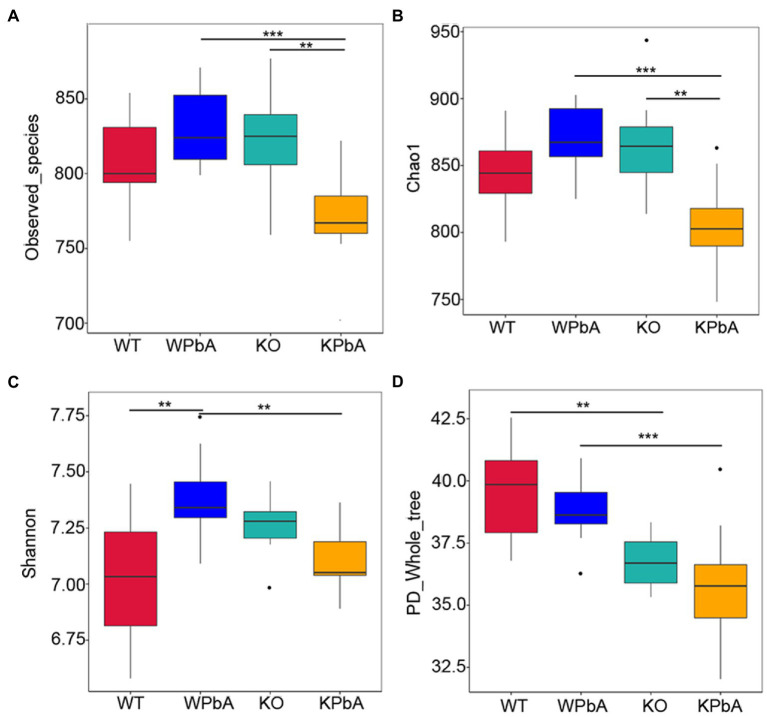
Figure 3.
The richness and diversity of microbes within communities by alpha analysis. (A) Observed_species, (B) Chao1, (C) Shannon, and (D) PD_whole_tree. Differences among groups regarding the alpha diversity index were obtained in R software using the Wilcoxon test. Significant differences are indicated via **p < 0.01 and ***p < 0.001.

