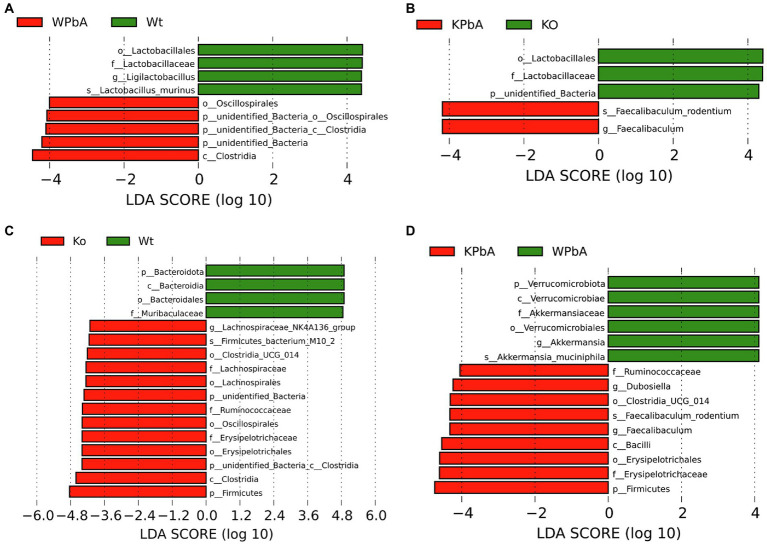
Figure 5.
The differentially abundant bacterial taxa identified by LEfSe among different groups. (A) Linear discriminant analysis (LDA) score distribution between the WT and WPbA groups. (B) LDA score distribution between the KO and KPbA groups. (C) LDA score distribution between the WT and KO groups. (D) LDA score distribution between the WPbA and KPbA groups. The histogram of LDA value distribution only showed the species whose LDA score was greater than the default setting (threshold > 4), which represented the biomarkers with significant differences between groups.

