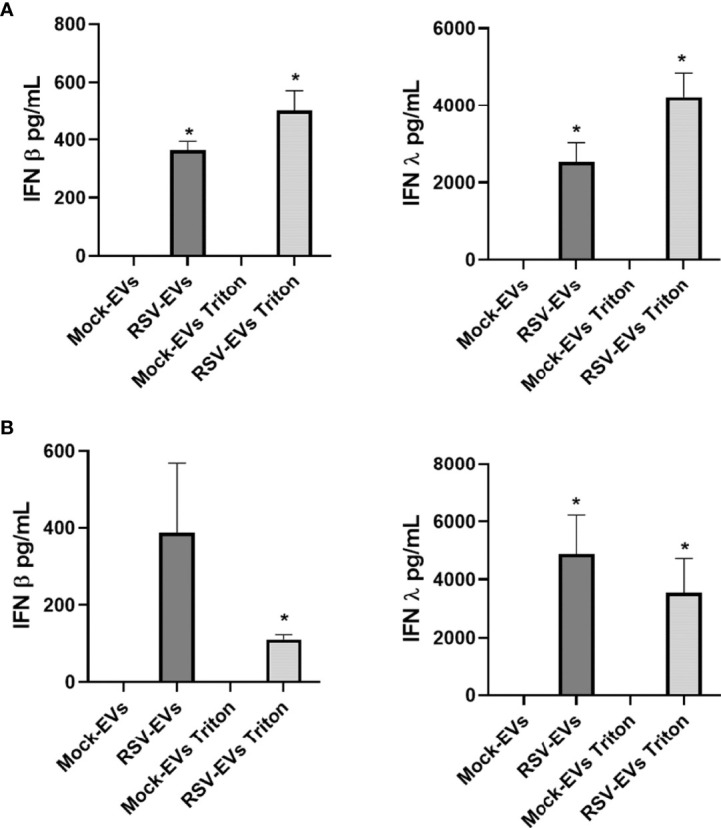
Figure 2.

IFN-β and IFN-λ concentrations associated with EVs released from mock- and RSV-infected A549 (A) and SAE cells (B). IFN-β and IFN-λ were measured by ELISA as intact or Triton lysed EVs. Data are presented as mean ± SEM. * indicates a statistical difference comparing RSV- EVs or RSV-EVs Triton versus Mock-EVs or Mock-EVs Triton, respectively (*p value < 0.05). Data represents the average of three independent experiments.
