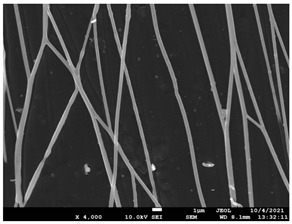
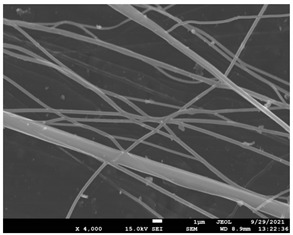
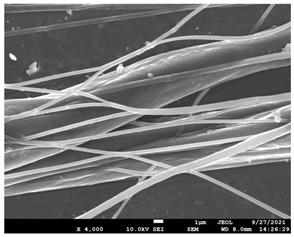
Table 4.
SEM images presenting the effect of concentration of the polymer solution on the electrospun structure of PCL with 71,000 g/mol.
| Concentration of PCL 71,000 g/mol in Chloroform (% w/v) | Mean Fibers Diameter (μm)/Standard Deviation | SEM Images |
|---|---|---|
| 12 | 0.087/0.033 |

|
| 15 | 0.144/0.068 |

|
| 17 | 0.302/0.284 |

|
