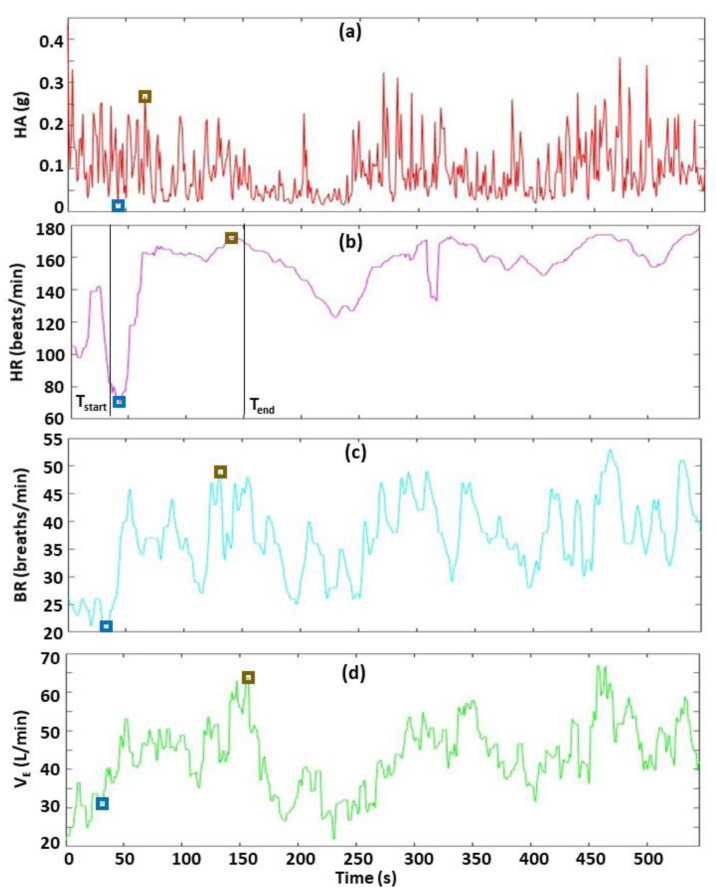
Figure 5.
Demonstration of Menu Option 3—calculate summary statistics for biometrics. The four biometrics are HA (a), HR (b), BR (c) and VE (d). In this example, the user selected a time range (Tstart—Tend) that has substantial changes in HR. The user positions a cursor in the window displaying the HR data, and clicks at two time points (Tstart, Tend) to define the time range (black vertical lines). Then, the software automatically calculates and displays the statistics for all four biometrics (HR, BR, VE, HA) in this time range. The blue and brown boxes indicate the time when minimum and maximum values occur in this time range, respectively.

