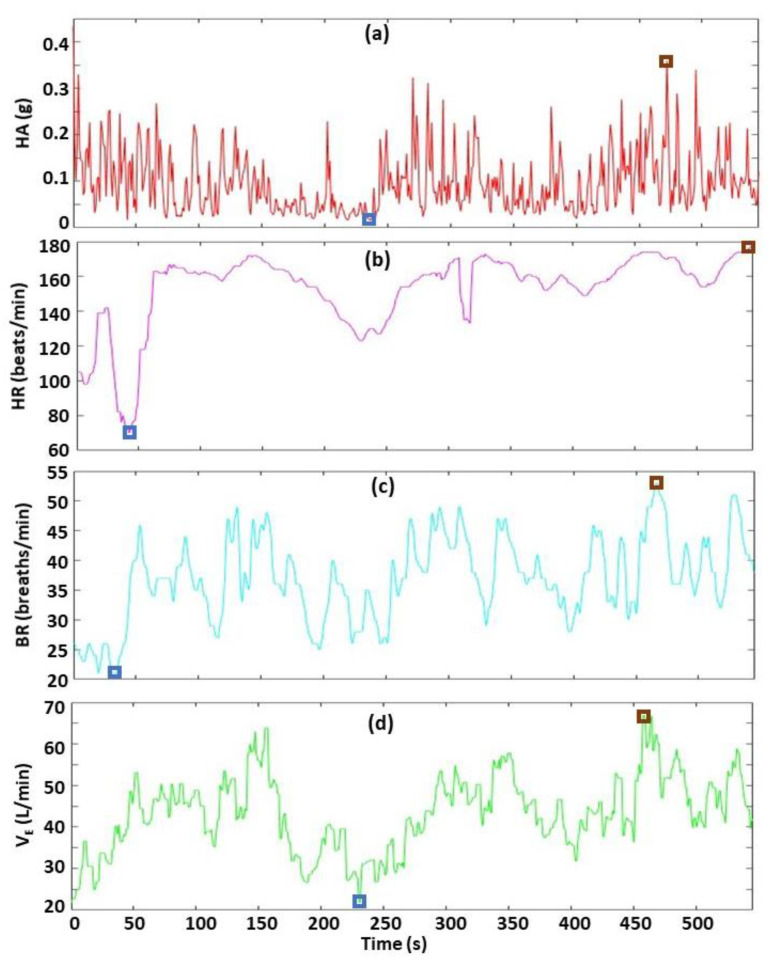
Figure 6.
Characterization of the biometrics across entire climbing time. The four biometrics are HA (a), HR (b), BR (c) and VE (d). The blue and brown boxes indicate the minimum and maximum values, respectively. The large spike in HA at time = 0 is the calibration sample used to time-match the biometric data with the climbing video (details provided in Methods Section 2.3). This HA data point is excluded from the summary statistics (e.g., minimum, maximum) since it occurs when the climber intentionally drops 30 cm to the floor, immediately before starting the climb.

