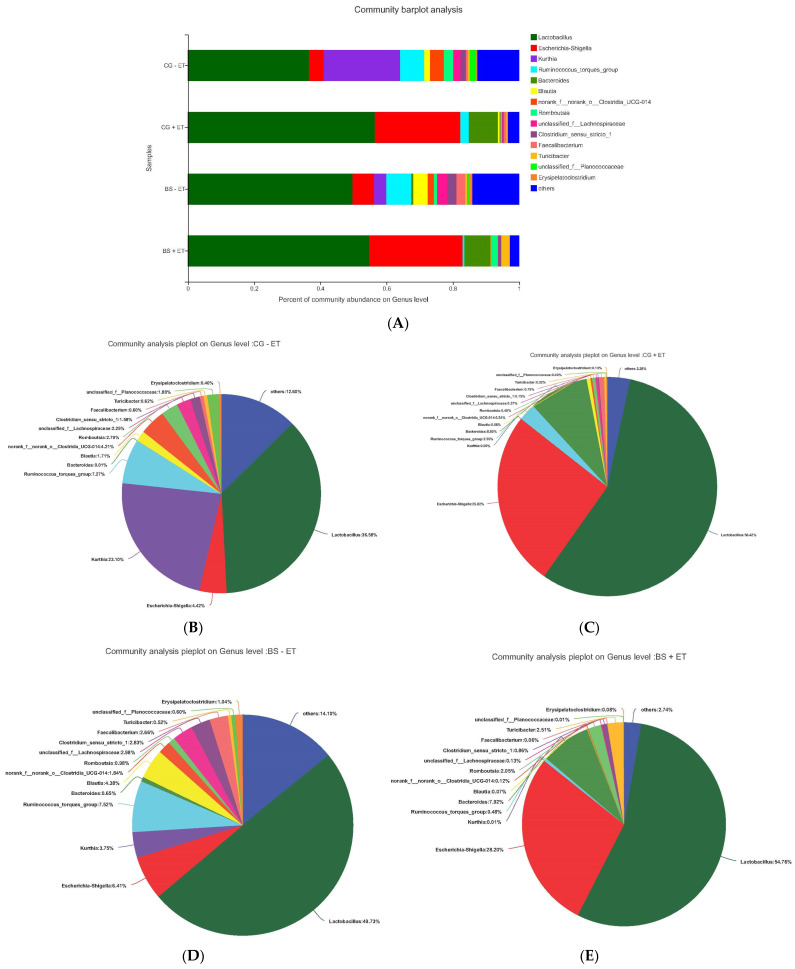
Figure 4.
Relative abundances of the taxa at genus level. (A) Relative abundances of the affected taxa at genus level among all groups. (B) Total affected percentage of each genus in group CG − ET. (C) Total affected percentage of each genus in group CG + ET. (D) Total affected percentage of each genus in group BS − ET. (E) Total affected percentage of each genus in group BS + ET.

