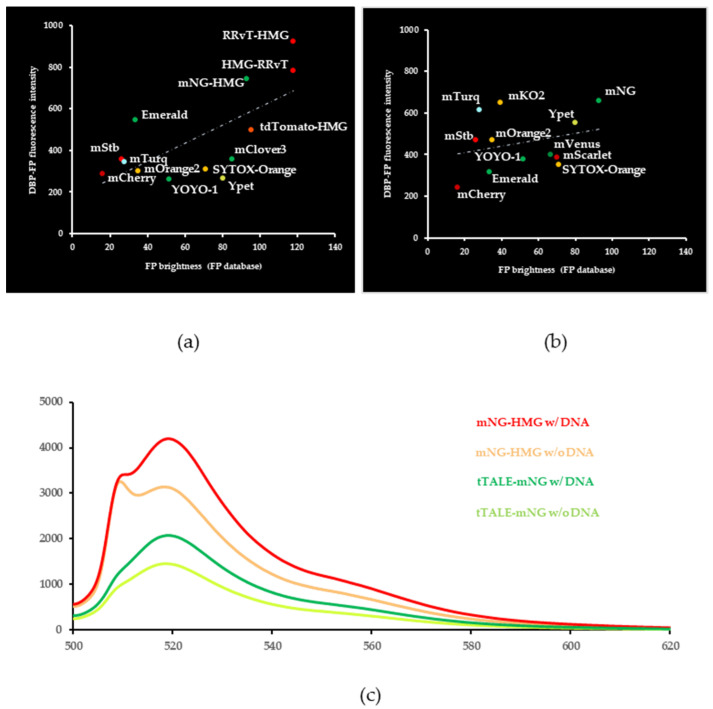
Figure 2.
Fluorescence comparison between reference and measured values. (a) HMG (b) tTALE linked FP brightness was obtained from the FPbase.org (X-axis), and FP-DBP fluorescence intensities were measured from microscopic images (Y-axis). If the DBP name was omitted, DBP was linked N-terminal to FP. The dotted lines are calculated for a linear relationship. R2 was 0.48 for HMG constructs (a) and 0.08 for tTALE constructs (b). FP abbreviated names: mNG, mNeonGreen; mStb, mStrawberry; mTurq, mTurquoise2. (c) Fluorescence spectra of mNG-HMG and tTALE-mNG with and without DNA.

