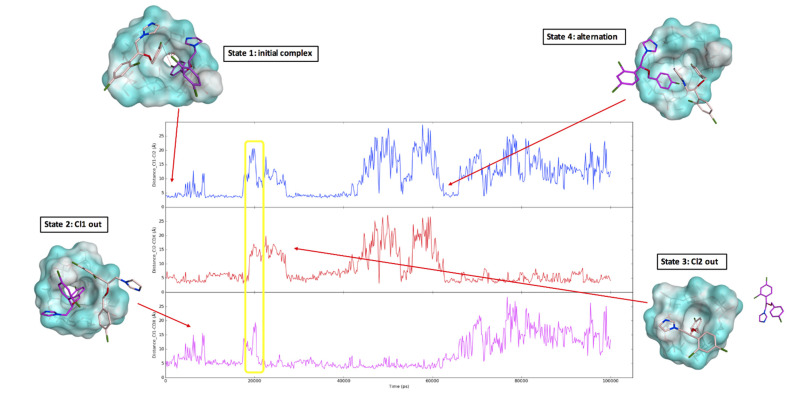
Figure 5.
Molecular dynamic simulation results. The three graphs show the distance between the two chlorine atoms from the mono-chloro phenyl ring of the two drugs (Cl1 and Cl2, blue line) and the distance between each chlorine atom and a CD central oxygen atom (Cl1-CDX, purple line, Cl2-CDX, red line). Four different states were observed during the simulations: state 1, a 2:1 complex in which the three monitored distances were constant; state 2, in which Eco-1 (Cl1) was released from the cyclodextrin (with increases in the Cl1-CDX (purple line) and Cl1-Cl2 (blue line) distances); state 3, in which Eco-2 (Cl2) was released from the cyclodextrin (with increases in the Cl2-CDX (red line) and Cl1-Cl2 (blue line) distances); state 4: alternation between the two econazole molecules occupying the cyclodextrin cavity (in this specific moment of the simulation, Eco-2 was approaching the cyclodextrin (decrease in Cl2-CDX distance—red line), while Eco-1 was slowly coming out (increase in the Cl1-CDx distance—purple line)). The yellow circle highlights a brief simulation instance in which the two econazole molecules were both outside of the cyclodextrin cavity. Distance (Y axis) was measured in Å, time (X axis) in ps. Econazole carbon atoms are in pink (Eco-1) and purple (Eco-2). HP-β-CD is represented as a molecular surface. Water molecules from the simulation environments have been removed for the clarity of the image.

