Figure 1.
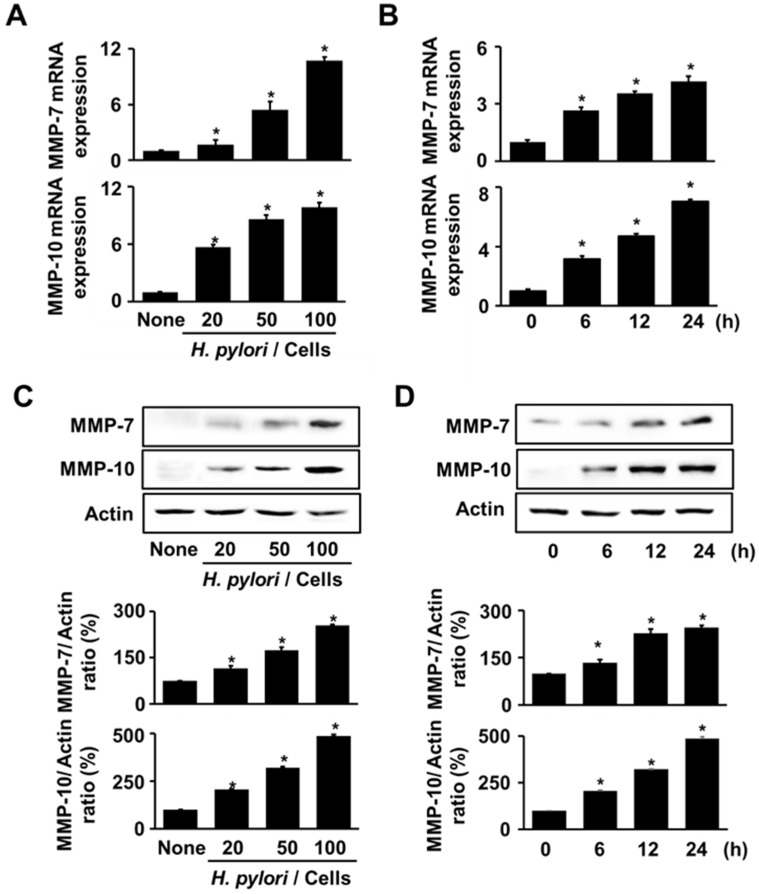
H. pylori increased MMPs expressions. (A,C) H. pylori was treated to the cells at the various ratios (H. pylori/cells) for 24 h. (B,D) H. pylori was treated to the cells at a 50:1 bacteria/cell ratio for the indicated durations. (A,B) mRNA expressions of MMP-7 and MMP-10 were analyzed via real-time PCR and normalized to β-actin mRNA expression. All values are expressed as the mean ± standard error (SE) of three independent experiments. (C,D) Protein levels of MMP-7 and MMP-10 were determined via western blot analysis. Actin was used as a loading control (upper panel). The densitometry data represent the mean ± standard error (SE) from three immunoblots and are shown as the relative density of protein bands normalized to actin (lower panel). * p < 0.05. vs. ‘None’ (uninfected cells) or 0 h.

