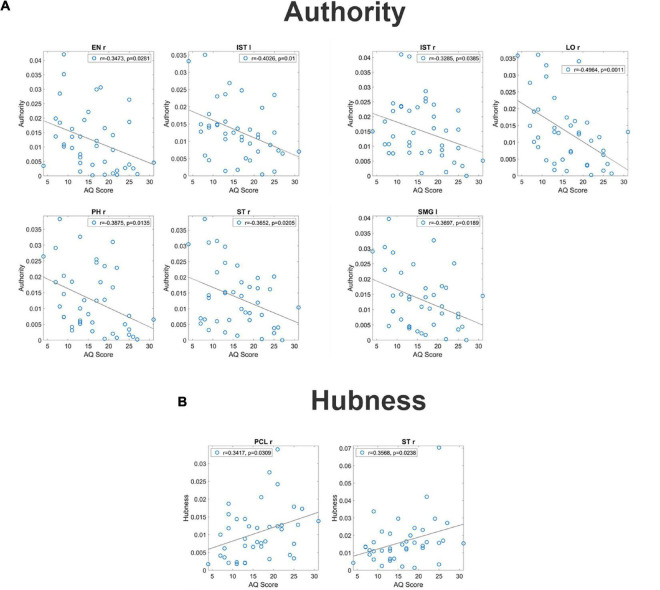
FIGURE 2.
Correlation between the authority and the AQ score [upper panel (A)] and correlation between the hubness and the autistic score [bottom panel (B)] for all ROIs which exhibit a significant p-value (uncorrected) for the correlation. These correlations have been computed on the complete normalized connectivity matrix. It is worth noting that the correlation is negative for the authority, denoting a more significant input flow in the Low AQ score Group, while correlation is positive for the hubness, denoting a more significant output flow for the High AQ score Group.

