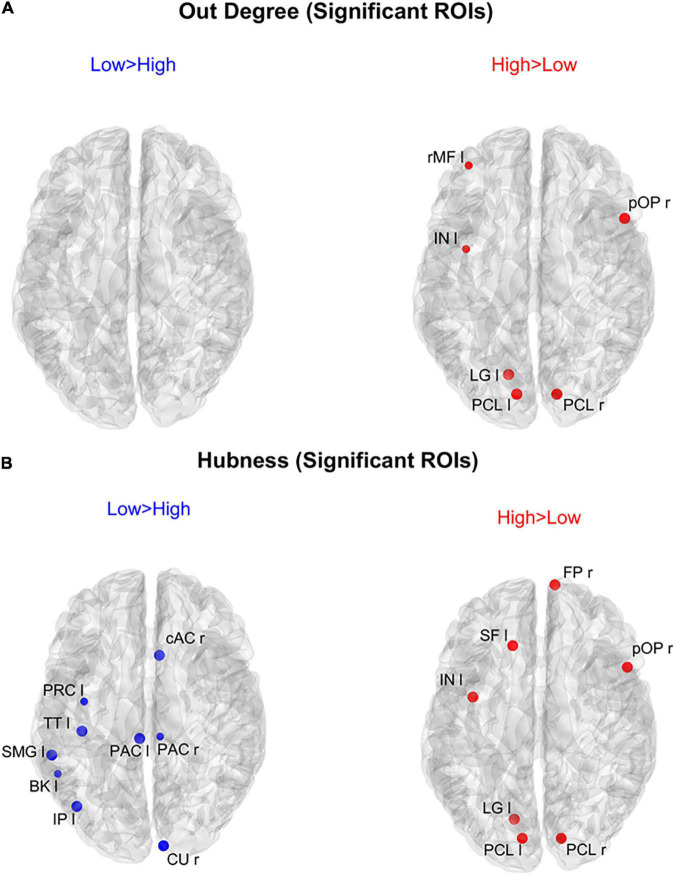
FIGURE 8.
Positions of the ROIs which exhibited a significant difference in the out degree index [upper panels (A)] or in the hubness index [lower panels (B)] between the two groups (p-value < 0.05, Bonferroni corrected). The left panels in blue (Low > High) display the ROIs having significantly higher centrality index in the Low AQ score Group compared to the High AQ score Group. The right panels in red (High > Low) display the ROIs having significantly higher centrality index in the High AQ score Group compared to the Low AQ score Group. The significant ROIs are shown as simple dots and represent regions from which important information originates. Three levels of dots’ size have been adopted: the larger the dot size, the more significant the centrality difference. For the panels where no dot appears over the brain map (i.e., out degree for Low > High), the constraint of significance was not satisfied by any of the 68 ROIs.

