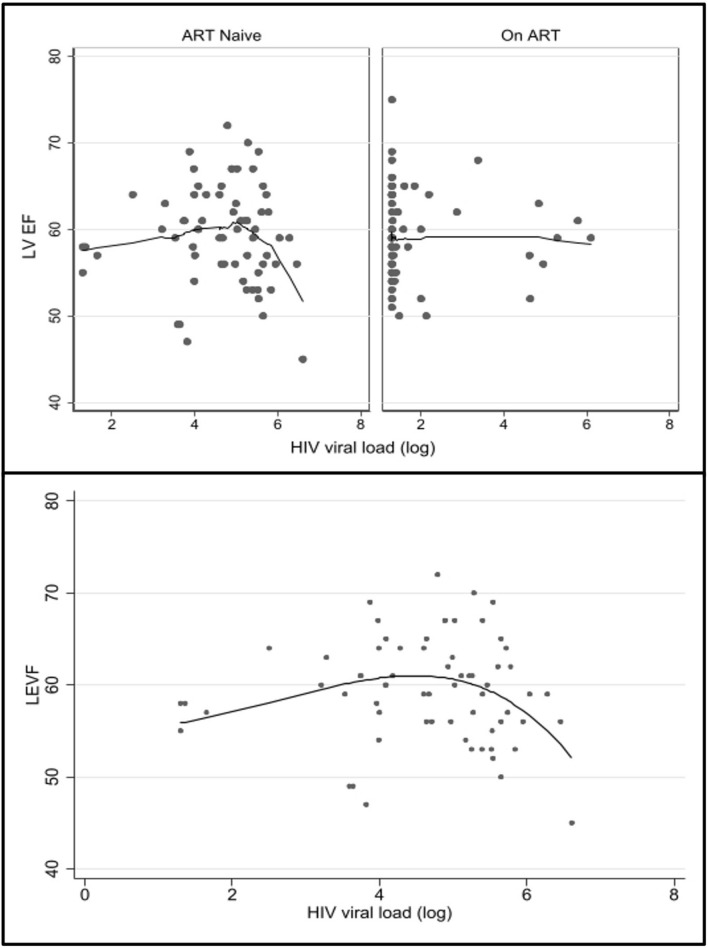
Fig. 2.
Top: Scatter plot with a fitted line using the Lowess smoothing demonstrating a negative, non-linear association between left ventricular ejection fraction (LVEF) and HIV viral load (log). Below: A fractional polynomial model of LVEF and HIV viral (log), demonstrating a decrease in the LVEF is evident at log 5, suggesting a high viral load decrease LVEF by an unknown mechanism (p = 0.02). A similar negative, non-linear association (not shown) was seen with right ventricular ejection fraction and HIV viral load (log) (p = 0.02)

