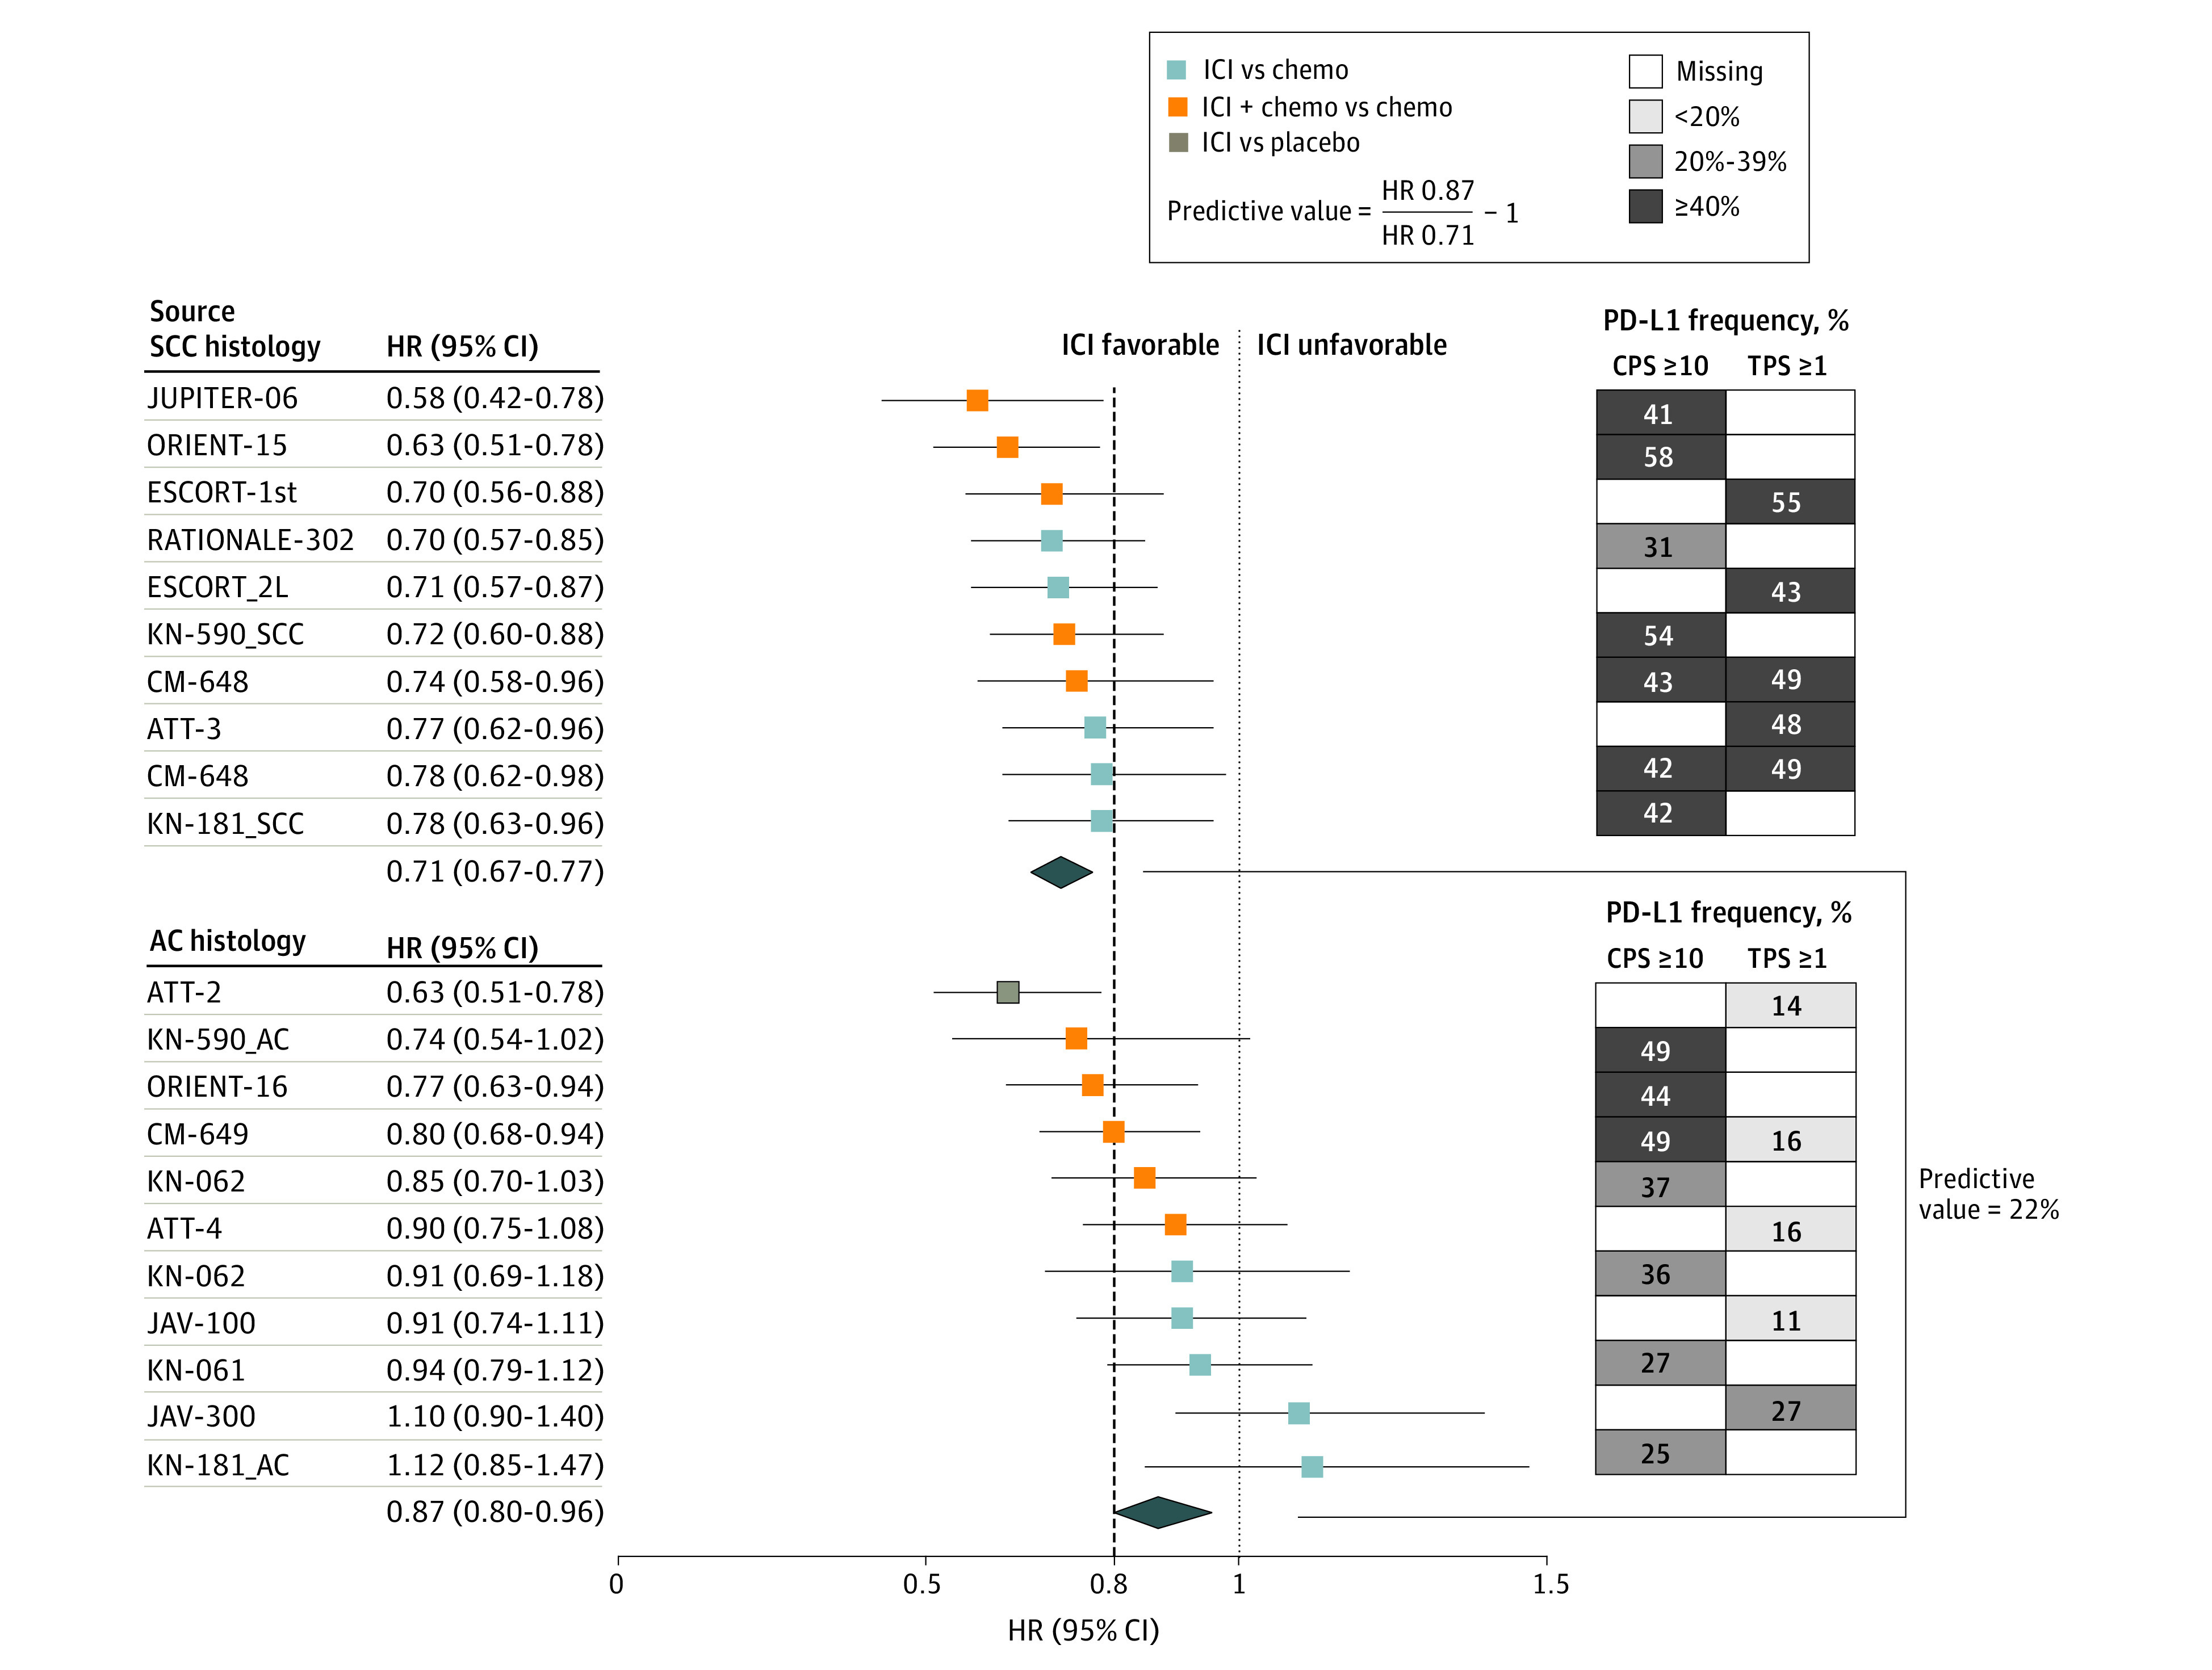
Figure 1. Phase 3 Randomized Clinical Trials Evaluating ICI by SCC and AC Histology.

The forest plot shows HRs (95% CI) for OS for each trial (left). The pooled (mean) HR was 0.71 (95% CI, 0.67-0.77) for SCC (9 trials; 10 treatment comparisons) and 0.87 (95% CI, 0.80-0.96) for AC (10 trials; 11 treatment comparisons), yielding a predictive value for histology ([0.87 ÷ 0.71] – 1) of 22% favoring SCC (right). The dashed line denotes the ASCO-recommended HR of 0.80. On the right, the grid shows the frequency of patients in each trial who had positive tissue-based PD-L1 expression (CPS ≥10 or TPS ≥1). The darkest squares are trials most enriched with PD-L1−positive patients. In ORIENT-15, the proportion of tumors with TPS ≥10 was 36%. In the ICI vs chemotherapy comparison for KN-062, the CI was 99.2%. The Table provides the citations and reference numbers for each trial. ASCO indicates the American Society of Clinical Oncology; HRs, hazard ratios; ICI, immune checkpoint inhibition; OS, overall survival; PD-L1, programmed death-ligand 1; SCC, squamous cell carcinoma; and TPS, tumor proportion score.
