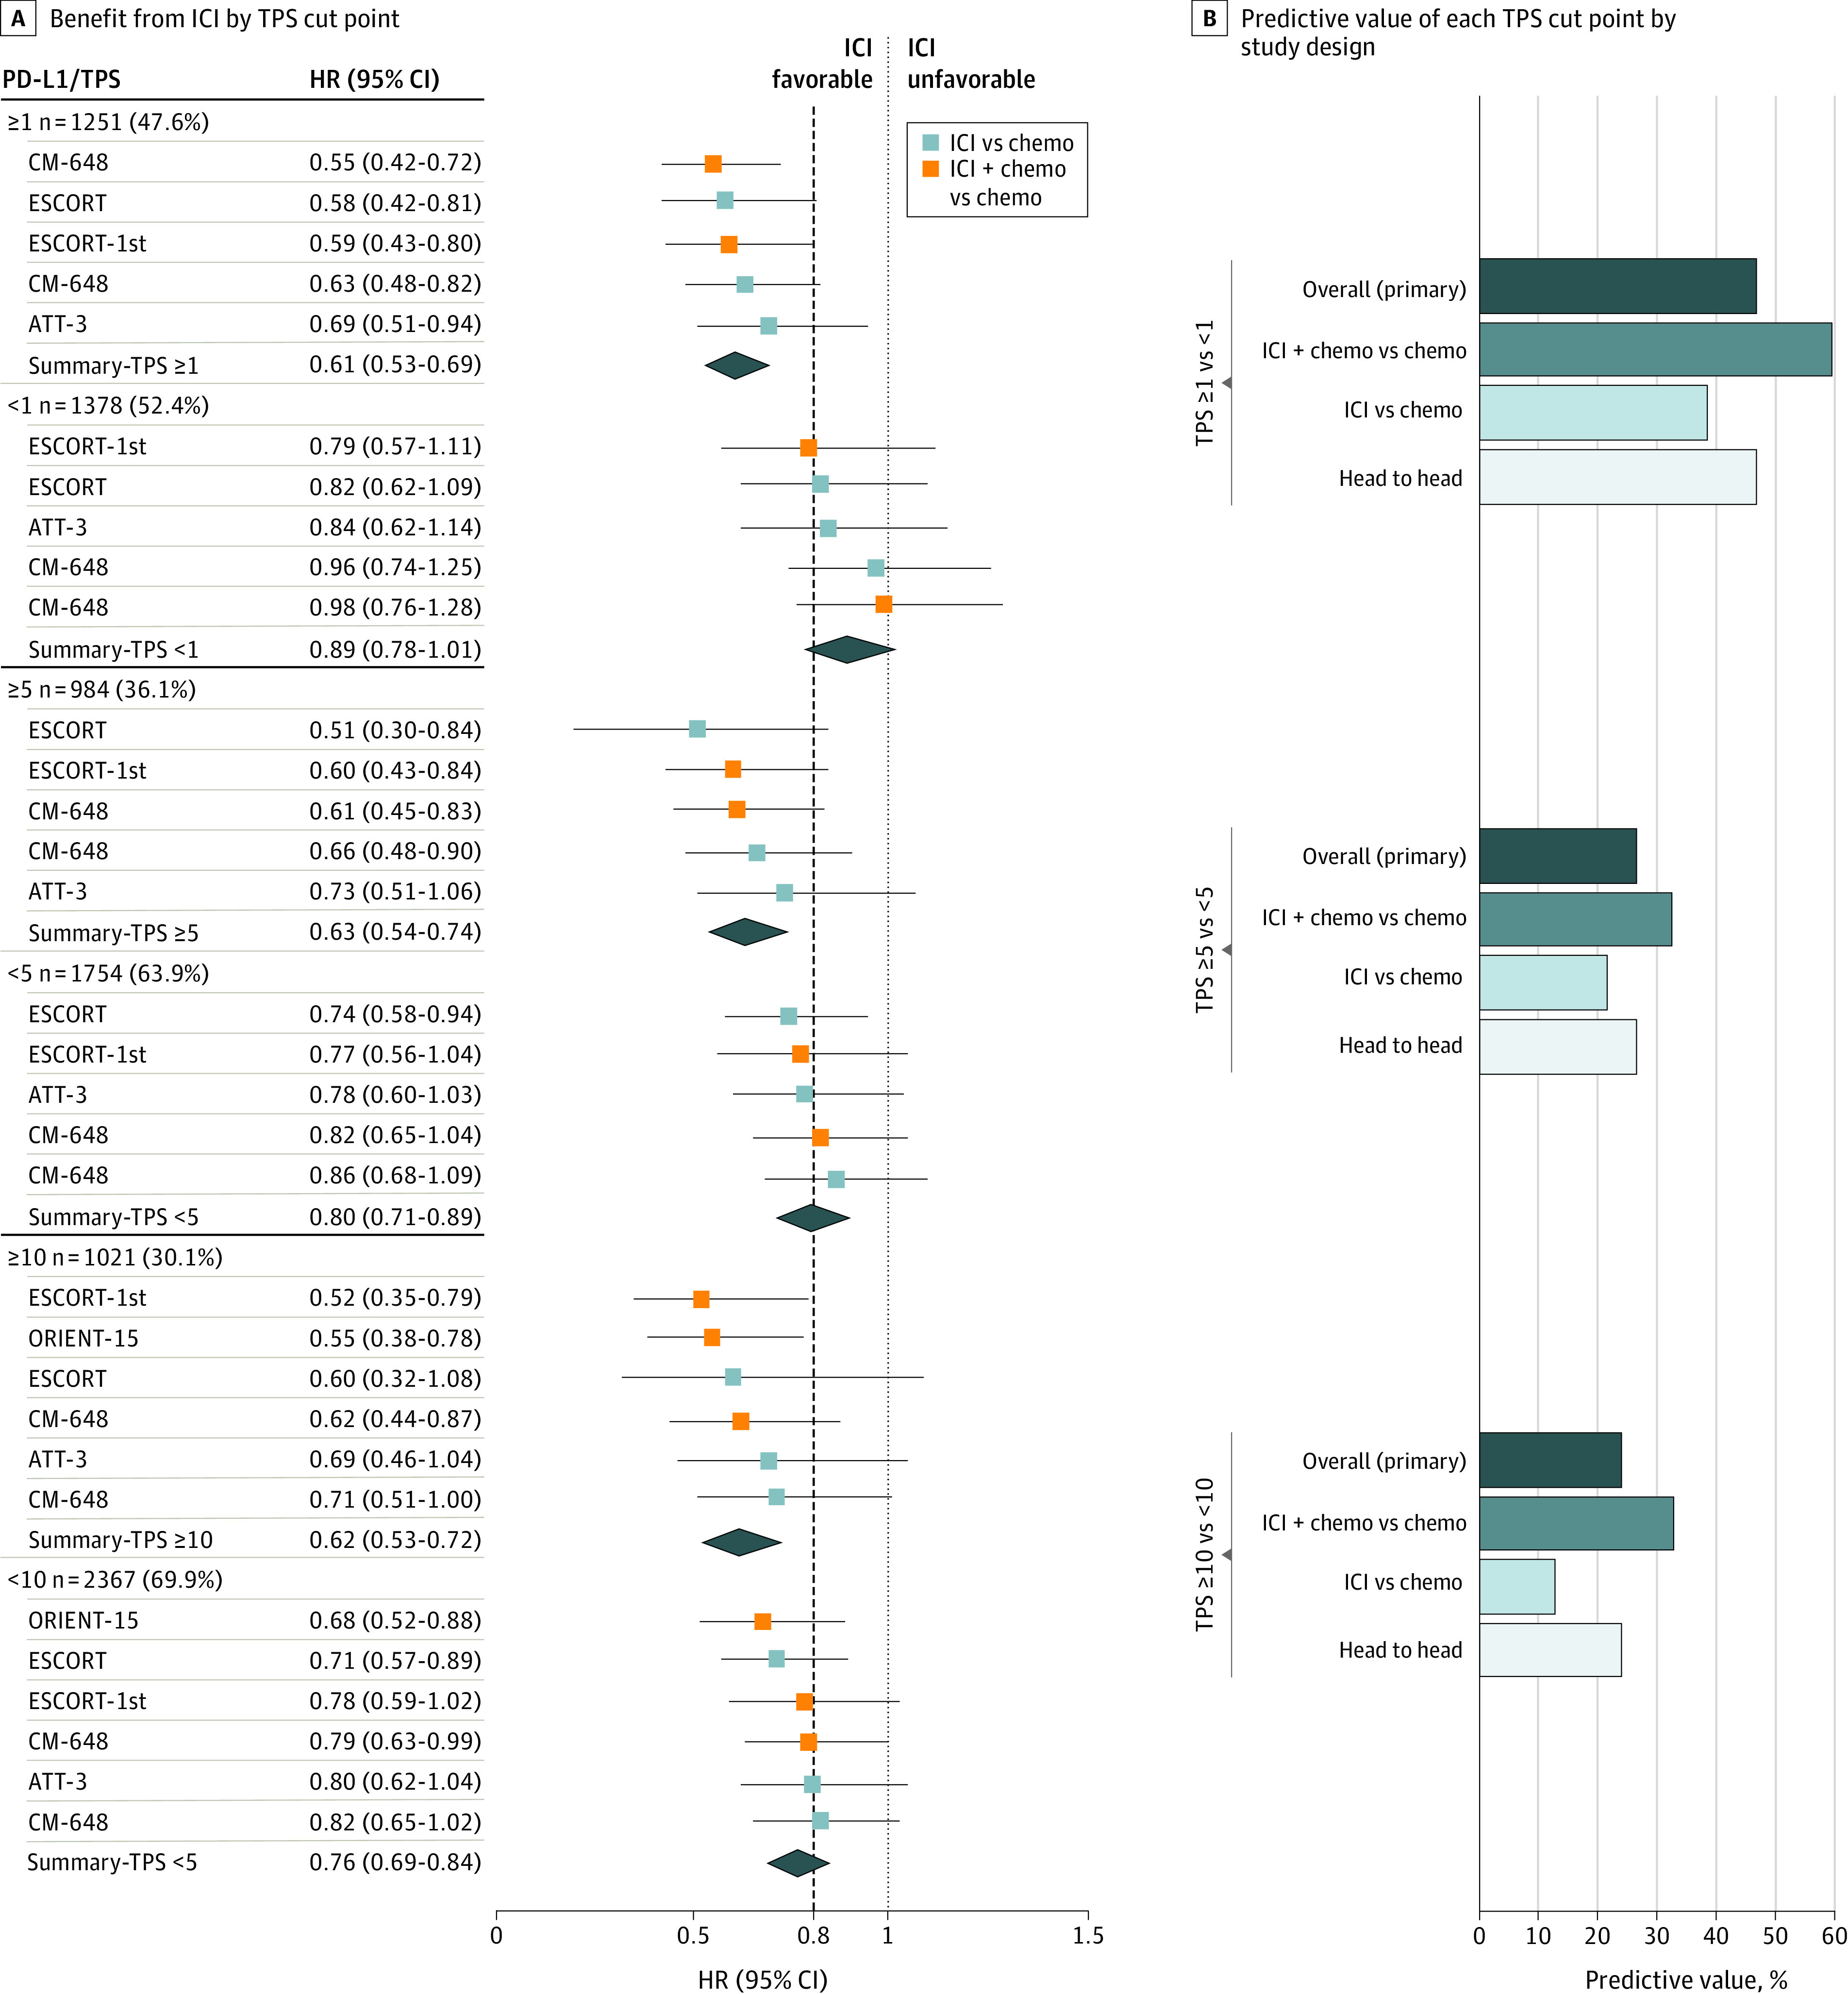
Figure 3. Predictive Value of PD-L1 TPS at Multiple Cut Points in SCC.

A, A meta-analysis of individual trials with pooled (mean) HRs for OS and 95% CIs shown at each cut point of TPS. The dashed line denotes the ASCO-recommended HR of 0.80. B, The bar graphs indicate each cut point’s predictive value (ie, ratio of mean HRs across each level of the cut point; right). The predictive value was calculated in all trials (primary analysis) as well as in 3 sensitivity analyses—ie, the subset of trials that compared ICI plus chemotherapy vs chemotherapy and that compared ICI vs chemotherapy, and the subset of trials amenable to head-to-head analysis (those that reported OS outcomes for both levels of each variable). The Table provides the citation and reference numbers for each trial. AC indicates adenocarcinoma; ASCO, American Society of Clinical Oncology; CPS, combined positive score; HR, hazard ratio; ICI, immune checkpoint inhibition; OS, overall survival; PD-L1, programmed death-ligand 1; SCC, squamous cell carcinoma; and TPS, tumor proportion score.
