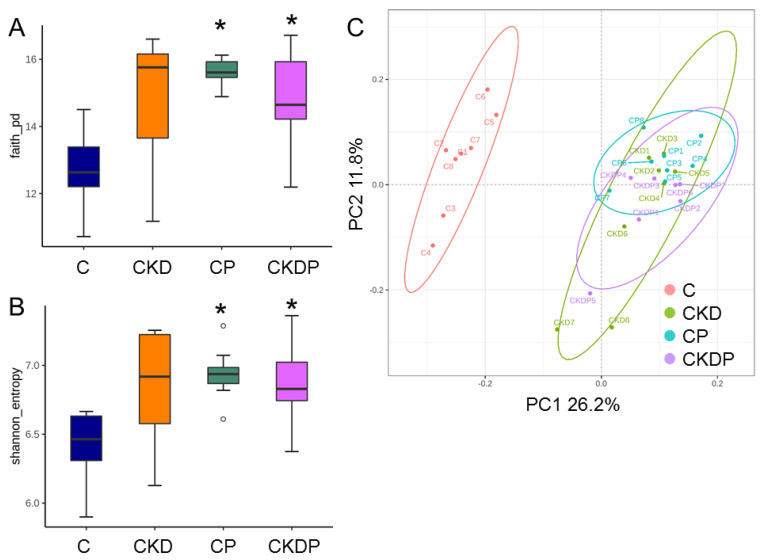
Figure 5.
Comparison of bacterial α-diversity across four groups of offspring at the age of 12 weeks in (A) Faith’s phylogenetic diversity (PD) index and (B) Shannon index; (C) principal coordinate analysis (PCoA) based on unweighted UniFrac distance of the OTUs in four groups. Each point represents the microbiota of a single sample, and colors reflect metadata for that sample. * p < 0.05 vs. C.

