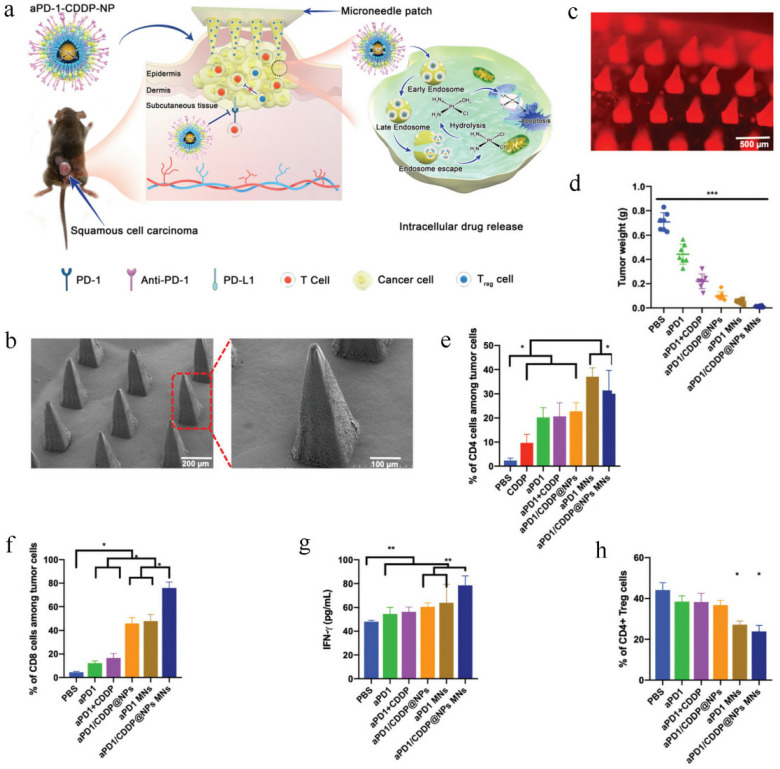
Figure 8.
Schematic diagram of synergistic effect of immunochemotherapy by a microneedle patch containing aPD-1/CDDP@NPs. Reprinted with permission from Ref. [258]. 2020, Royal Society of Chemistry. (a) The mechanism of enhanced immunotherapy induced by aPD-1/CDDP@NP MNs. (b) SEM images of dissolving microneedles. (c) Fluorescence microscopy image of the microneedles. (d) Antitumor efficacy in vivo. *** p < 0.001. (e) The positive rate of CD4+ T cells. * p < 0.05. (f) The positive rate of CD8+ T cells. * p < 0.05. (g) IFN-γ expression in the serum. ** p < 0.01. (h) The percentages of CD4+FOXP3+ Tregs. * p < 0.05.

