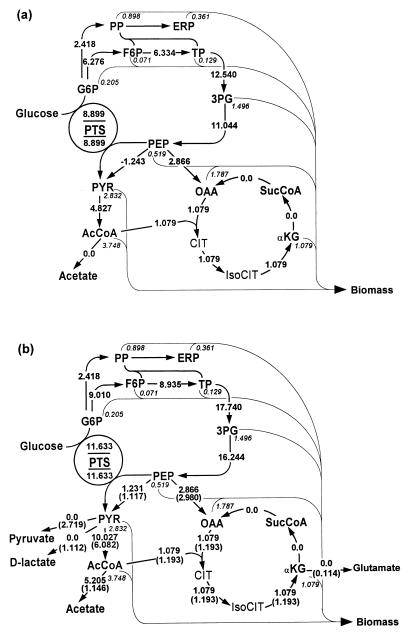
FIG. 6.
Stoichiometric calculation of metabolic flux distribution in E. coli. The flux distribution was analyzed by Holms’ method (16) with a slight modification in that the TCA cycle was assumed not to work in a cyclic mode but to function only for the generation of OAA, and α-ketoglutarate (2, 27, 36). Numbers in the middle of arrows indicate the fluxes through the specific metabolic step in the direction of the arrow. Italic numbers under precursor metabolites indicate the fluxes incorporated into biomass. A negative value means that the flux is in the direction opposite to the arrow. (a) Flux distribution in an ideal E. coli cell in which the central metabolism is working only for generating the exact amount of the required precursor metabolites and NADPH to make 1 g of biomass (25). The flux through a specific metabolic step was calculated by adding the amounts of precursor metabolites downstream of the metabolic step to make 1 g of biomass. In the resulting flux distribution, the amount of NADPH produced (4.319 mmol) was much smaller than that required to make 1 g of biomass (18.225 mmol). The shortage was covered by the uptake of additional (1.159 mmol) glucose and metabolizing it through the pentose phosphate pathway. (b) Flux distribution in wild-type E. coli in which the central metabolism works to supply the required amounts of precursor metabolites, NADPH, and ATP for 1 g of biomass and the production of acetate, which corresponds to 15% of input carbon. Numbers in parentheses indicate the fluxes for the pta mutant. The fluxes were calculated by adding the fluxes presented in panel a and the additional flux needed to produce acetate (wild type) or acetate, pyruvate, d-lactate, and glutamate (pta mutant). Abbreviations: AcCoA, acetyl CoA; α-KG, α-ketoglutarate; CIT, citrate; ERP, erythrose 4-phosphate; F6P, fructose 6-phosphate; G6P, glucose 6-phosphate; IsoCIT, isocitrate; 3PG, 3-phosphoglycerate; PP, pentose phosphate; PYR, pyruvate; TP, triose phosphate; SucCoA, succinyl CoA.

