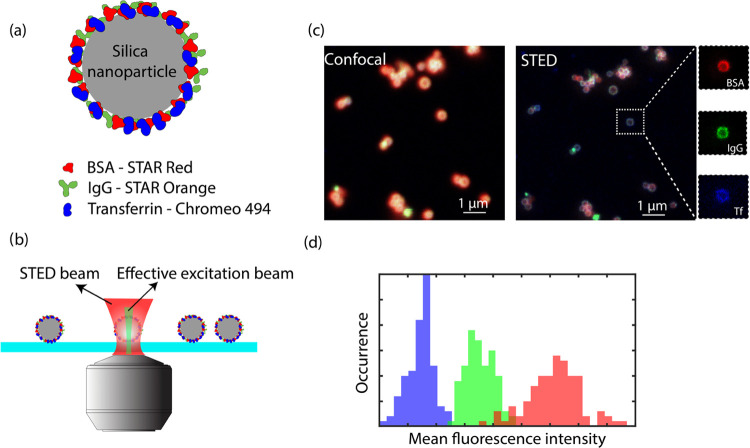
Figure 2.
Workflow of STED microscopy of protein corona on nanoparticles. (a) Scheme of fluorescently labeled protein corona formation on a silica nanoparticle. (b) STED measurement of immobilized nanoparticle–protein corona complex. (c) Comparison of diffraction-limited confocal and super-resolution STED images of the same field of view, and zoom-in STED images of the same particles with BSA in red, IgG in green, and Tf in blue channels, respectively. (d) Illustrative histogram (not real data) showing the mean fluorescence intensities of single particles in different color channels with matching color codes as in (c).

