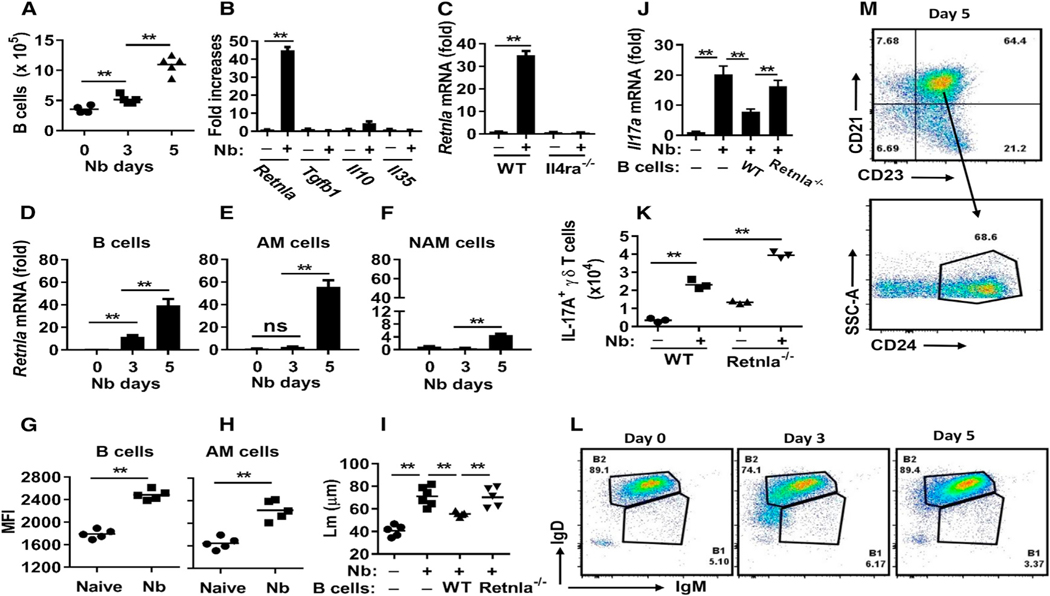
Figure 6. RELMα Expression by B Cells Is Required for Limiting Nb-Induced Emphysematous Pathology.
(A) B cell numbers in the lung at different time points after N. brasiliensis inoculation were assessed by flow cytometry.
(B) At day 5 after Nb inoculation, sort-purified B cells were analyzed for mRNA expression of candidate regulatory factors.
(C) Sort-purified B cells from Il4ra−/− and WT BALB/c mice were analyzed for Retnla mRNA expression at day 5 after Nb inoculation.
(D–F) Sort-purified B cells (D), alveolar macrophages (E), or non-alveolar macrophages (F) at different time points after Nb infection were analyzed for Retnla mRNA expression.
(G and H) RELMα mean fluorescence intensity (MFI) of lung B cells (CD19+) (G) and alveolar macrophages (H) was determined by cytoplasmic staining and FACS at day 5 after N. brasiliensis inoculation.
(I and J) Sort-purified B cells from either untreated Retnla−/− or WT mice were transferred to recipient Jh−/− mice at days −3, 0, and +1 after N. brasiliensis inoculation. Lungs were collected for analysis 7 days after inoculation, emphysematous pathology was digitally imaged as described in Figure 1 (I), and lung tissues were analyzed for the expression of Il17a by qPCR (J).
(K) Retnla−/− and WT mice were inoculated with Nb, and 2 days later, γδ T cells were assessed for IL-17A production by intracellular staining and flow cytometric analyses.
(L and M) FACS analysis of lung B cell subsets at day 5 after N. brasiliensis inoculation, showing expression of IgM and IgD (L) and CD21, CD23, and CD24 (M) on gated CD19+ lymphocytes.
Each symbol represents an individual mouse. Small horizontal lines indicate the mean (A and D–I), or data shown are the mean and SEM from five individual mice per group (B–F and J) or a pool of five mice per group (K and L). Data shown are representative of at least two independent experiments (**p < 0.01). See also Figures S4 and S5.

