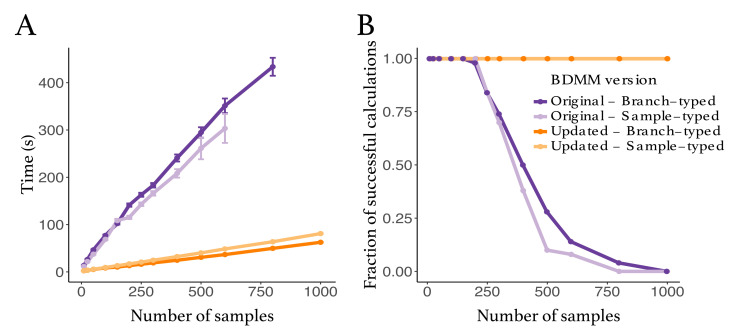
Figure 2.
Comparison between the original and the updated implementations of the multi-type birth–death model. (A) Speed comparison. Only successful calculations were taken into account, i.e., calculations where the log probability density was different from . (B) Success in calculating probability density values plotted against tree size. The values presented in this panel correspond to the same set of calculations as the one in panel (A).

