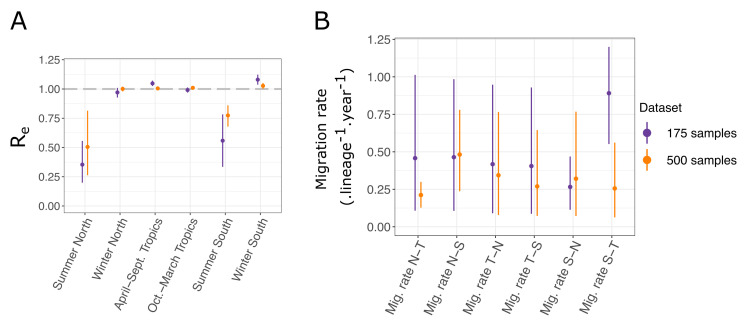
Figure 5.
(A) Seasonal effective reproduction numbers for each sample location, for both datasets. (B) Migration rates inferred for each dataset. N, S, and T refer respectively to North, South, and Tropics. For instance, “Mig. rate N-T” represents the migration rate from the Northern location to the Tropical one.

