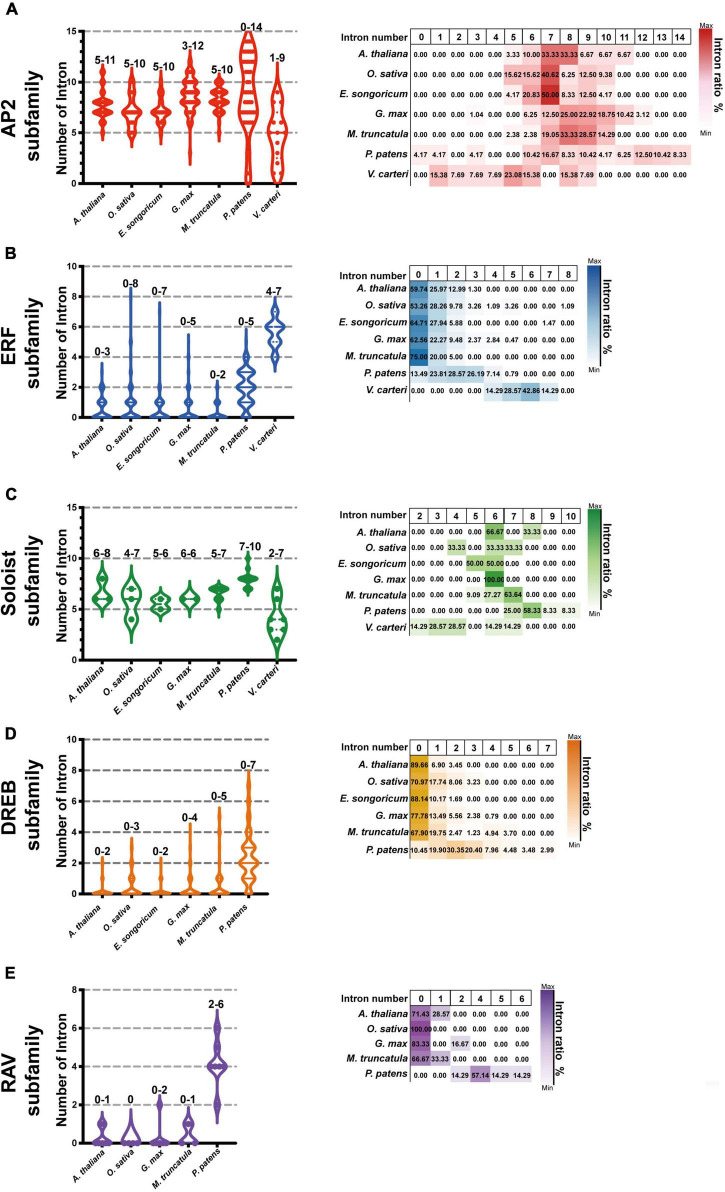
FIGURE 6.
Intron-exon number analysis of EsAP2/ERFs in seven plant species. The genome annotation of seven species including G. max and M. truncatula, Arabidopsis, O. sativa, P. patens, and V. carteri were used to investigate AP2/ERF family intron distribution. Graph pad prism 9 was used to produce box and violin plots; 153 EsAP2/ERF, 440 GmAP2/ERF, 237 MtAP2/ERF, 175 AtAP2/ERF, 193 OsAP2/ERF, 395 PpAP2/ERF, and 25 VcAP2/ERF genes were used for intron-exon distribution analysis. Panels (A–C) show intron numbers of AP2, ERF, and Soloist subfamily members of introns of seven plant species. The DREB and RAV subfamilies have not evolved in V. carteri, and Eremosparton songoricum does not contain the canonical RAV subfamily; thus, panel (D) shown are intron numbers and proportions of DREB subfamily from six species (excluding V. carteri). Panel (E) intron numbers of five species and proportions in the RAV subfamily (excluding V. carteri and E. songoricum). The intron number range is indicated on top of each column. The violin plots show intron member distribution, and the heatmap (right) shows gene proportions with different intron numbers as indicated by coloration.

