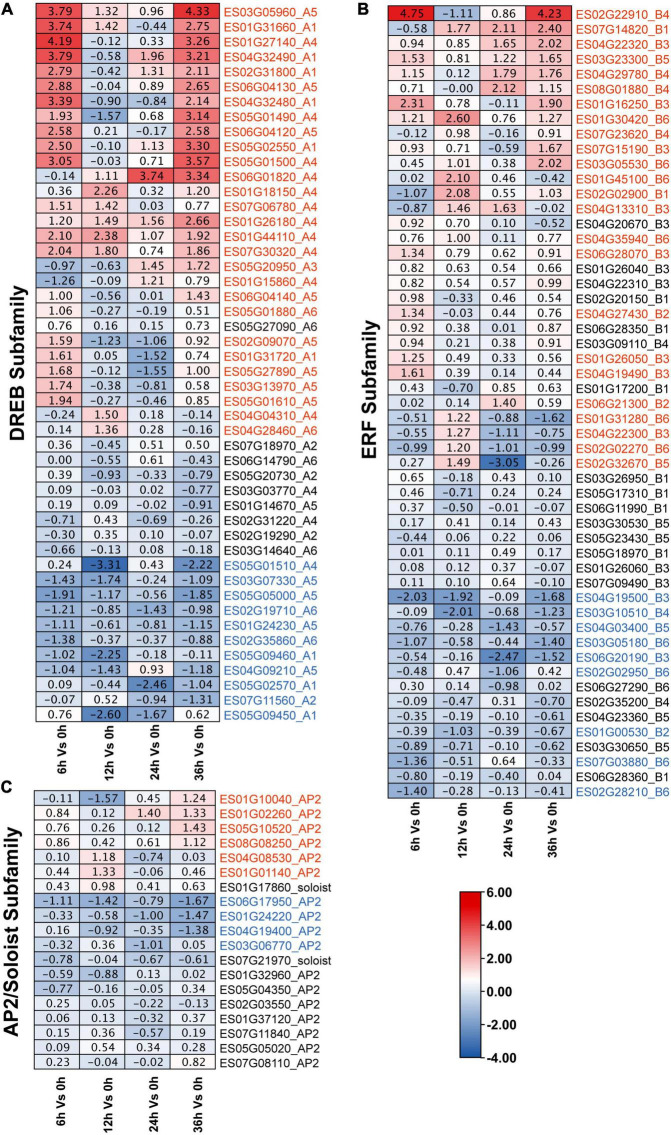
FIGURE 8.
Expression profiles of 120 EsAP2/ERF genes response to drought stress based on RNA-seq data. Expression profiles (in |log2fold change| values) of the (A) DREB; (B) ERF; and (C) AP2 and Soloist subfamily, respectively. Up-regulated genes were marked by red, down-regulated genes were marked by blue.

