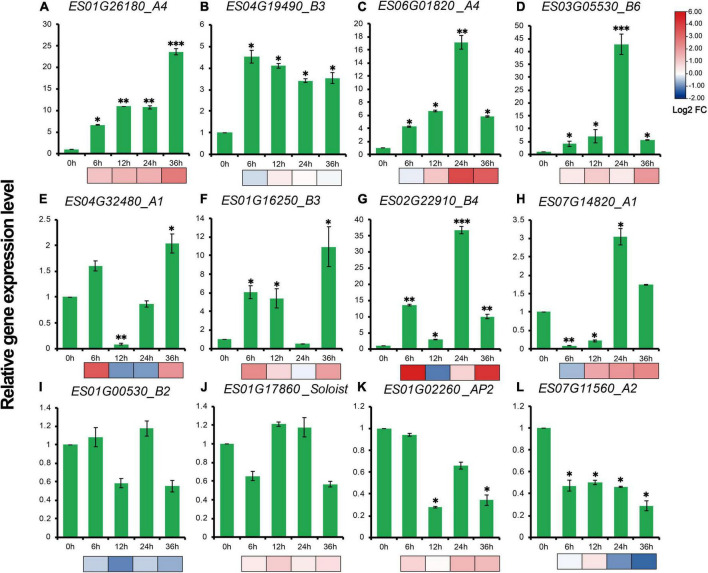
FIGURE 9.
(A–L) Gene expression levels of 12 EsAP2/ERF genes under drought treatment. The gene expression levels were calculated relative to 0 h using the 2–ΔΔCt method. Shown are the mean values ± SE of three replicates, and the significance level relative to controls is *P < 0.05; **P < 0.01; ***P < 0.001.

