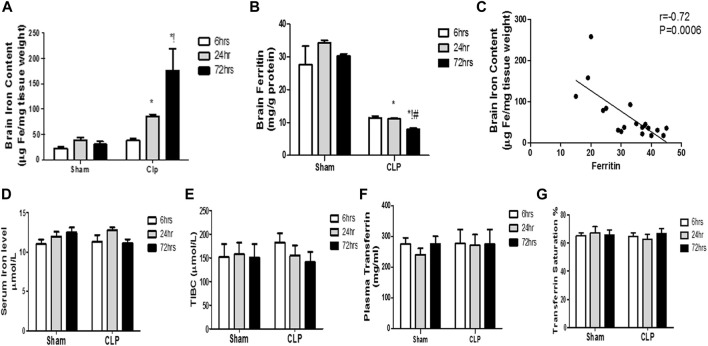
FIGURE 8.
Changes in serum transferrin and brain ferritin over time during sepsis. The quantitative analysis of brain ferritin (A) and serum transferrin (B) showed a significant decrease in brain ferritin level, but not in serum transferrin, at 24 and 72 h after sepsis. (C) Pearson’s correlation analysis between iron level in the brain and ferritin level. The serum iron level (D), the total iron binding capacity (TIBC) (E), the plasma transferrin (F), and the percentage of transferrin saturation (G) are not significantly different between the sham- and CLP-operated groups. Data are the means ± SEM. *p < 0.05 vs. the corresponding sham group; !p < 0.05 vs. the 6-h CLP group; # p < 0.05 vs. the 24-h CLP group. N = 10 rats per group.

