
Figure 2. mir-35 3′ end mutants do not alter decay.
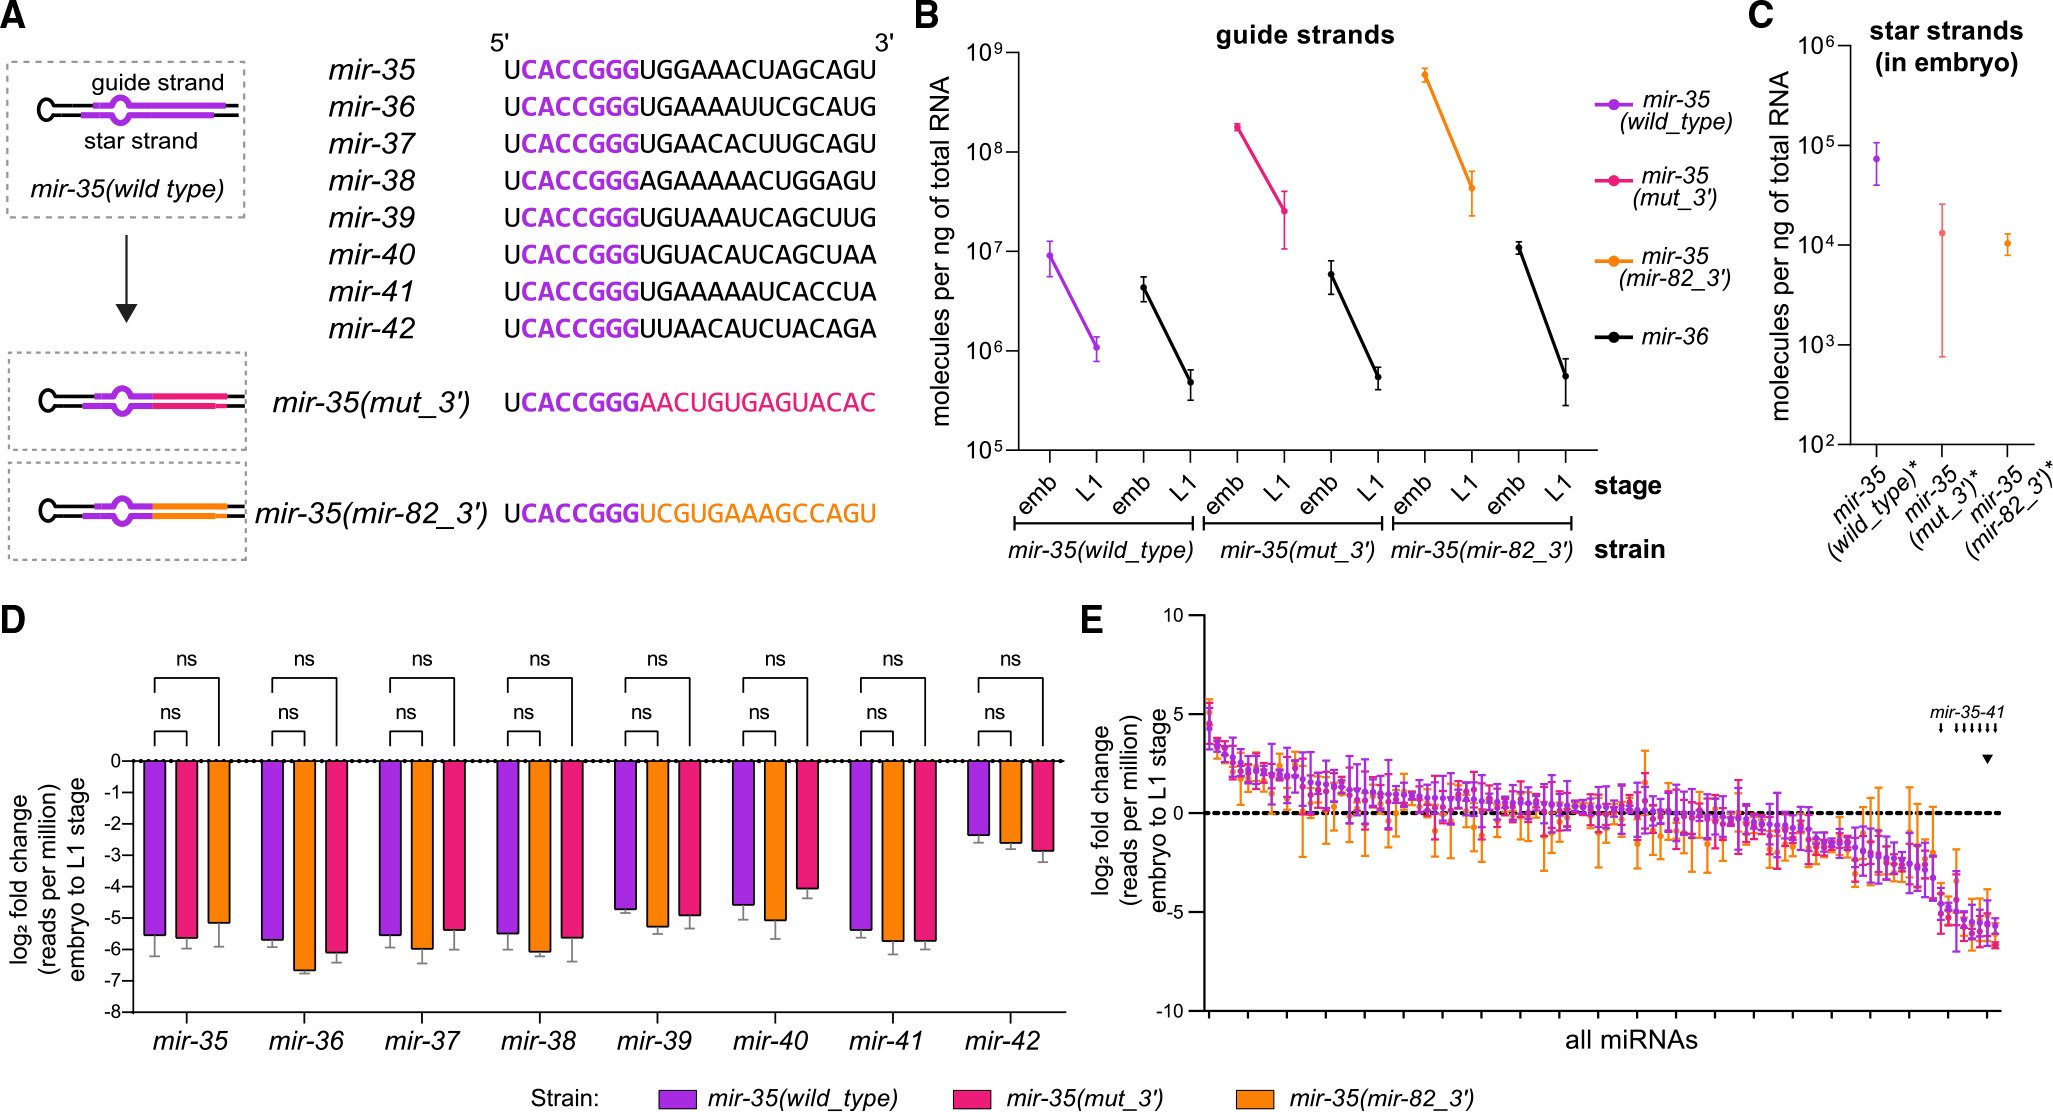
(A) Sequences of mir-35–42 with the identical seed sequences shown in purple (top). Schematic of the mir-35 3′ end mutants (bottom).
(B) Absolute quantification of mir-35 and mir-36 in embryos and L1. Mean and SEM of two to three biological replicates.
(C) Absolute quantification of star strands of mir-35 and mutant variants in embryos.
(D and E) Log2(fold change) from embryo to L1, calculated from normalized deep-sequencing reads for either the mir-35–42 family (D) or all miRNAs with >50 RPM in wild type (E). Note that color of bar indicates strain, not necessarily a mutant miRNA; only mir-35 is mutated in the indicated mutant strains.
(D) Two-way ANOVA was performed, followed by Dunnett’s multiple comparisons test.
(E) Small arrows indicate positions of mir-35–41 on ranked x axis, and arrowhead indicates mir-35 and mutant variants.
(C–E) Mean and SEM of three biological replicates.