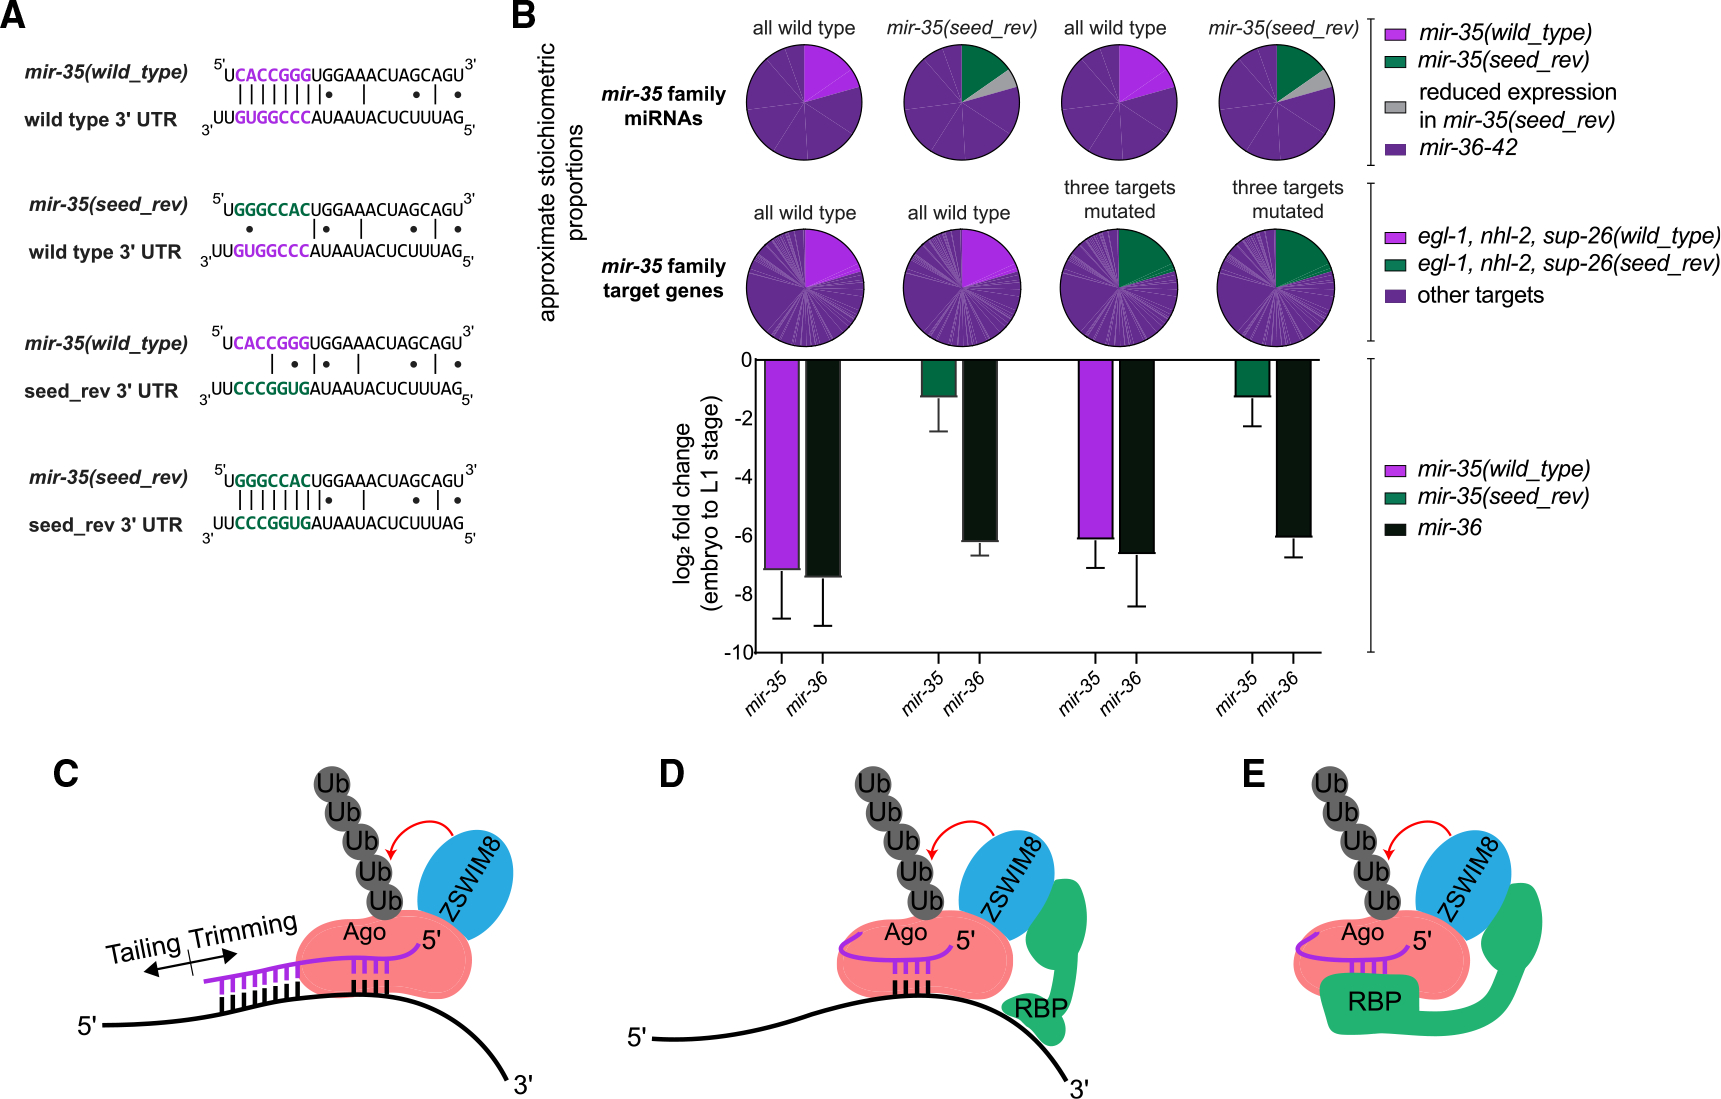
Figure 4. Reintroducing miRNA-target interactions does not restore decay of a seed mutant variant of mir-35.

(A) Representative miRNA-target interactions at the egl-1 3′ UTR.
(B) Top: pie charts represent the proportion of the mir-35 miRNA and target molecules that are mutated in each strain. Bottom: log2(fold change) from embryo to L1 in the indicated strains, as measured by Taqman qPCR. Mean and SEM of three biological replicates.
(C) Model of conventional TDMD.
(D and E) Alternative models for regulation of mir-35 family decay, in which the seed sequence is recognized by a complementary RNA (D) or an RNA-binding protein (RBP) (E).
