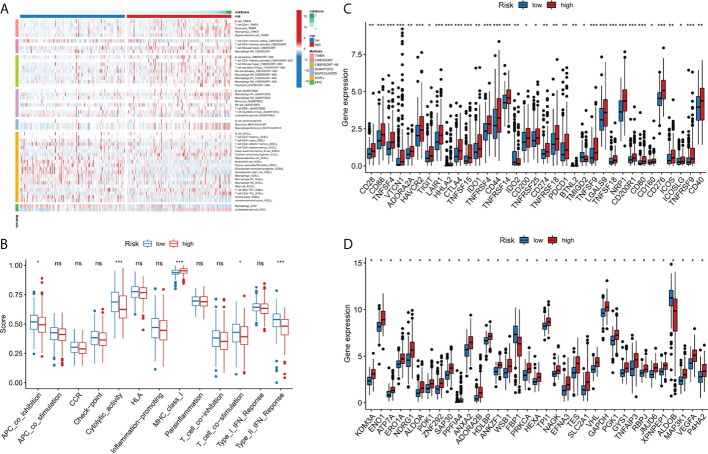
Figure 5.
Immune-related functional analysis. (A) The landscape of immune infiltration in two risk groups for liver cancer patients. (B) Boxplot visualizing differentially immune functions. “ns” stands for not significant. (C) Comparisons of immune checkpoints between the two risk groups in liver cancer patients. *p < 0.05; **p < 0.01; ***p < 0.001. (D) Comparison of the expression of hypoxia-associated genes between the two risk groups in liver cancer patients. *p < 0.001. ns, not significant.

