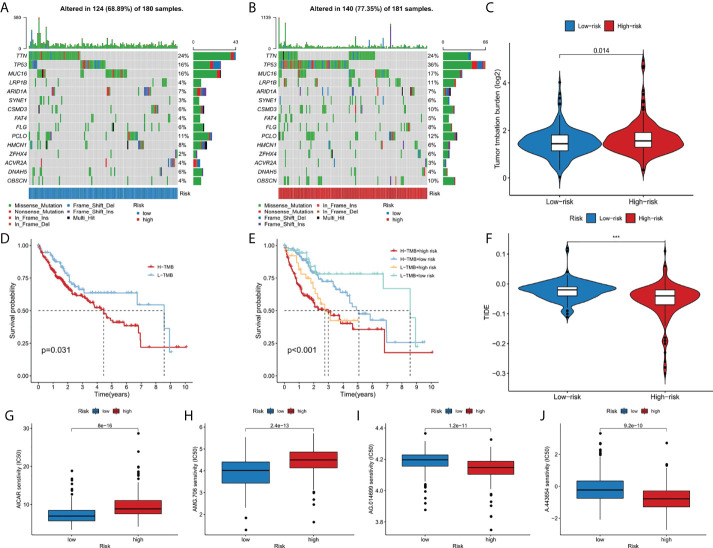
Figure 6.
The relationship between TMB and the 9-gene signature. (A, B) The oncoplots of the mutation genes in liver cancer patients for the high-risk and low-risk groups. (C) Higher TMB levels correlated with high-risk group. (D) Higher TMB level demonstrated poorer OS. (E) Kaplan-Meier curves for patients by both risk score and TMB. (F) Higher TIDE levels correlated with low-risk group. (G-J) Drug sensitivity analysis. ***p < 0.001.

