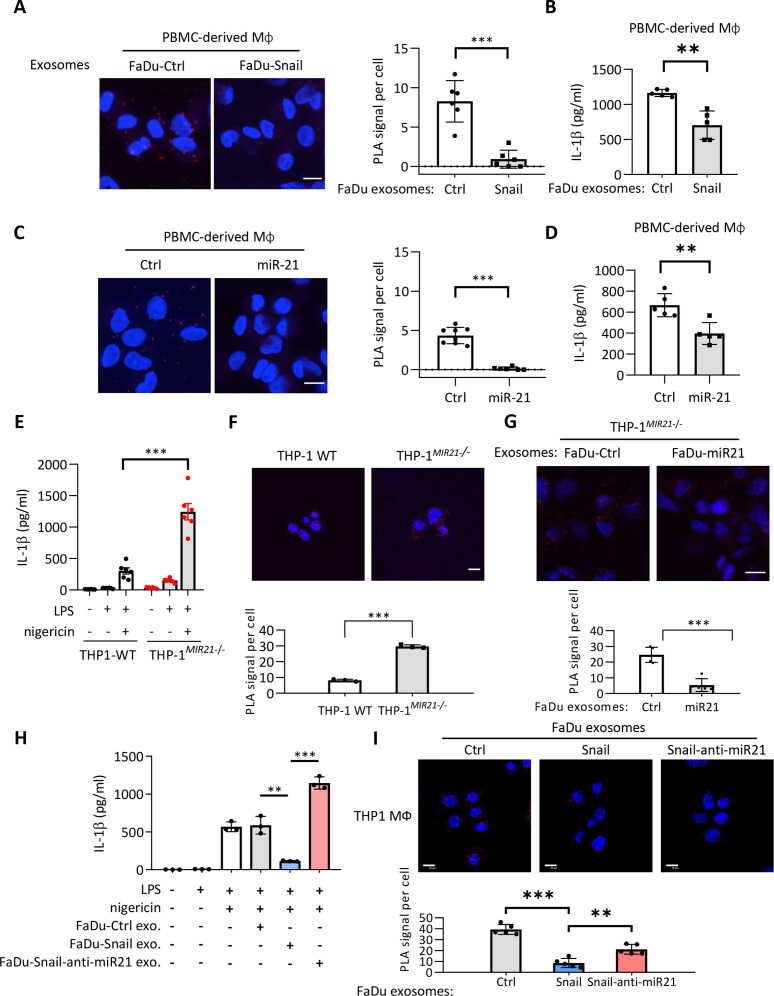
Figure 2.
Exosomes from Snail-miR-21 axis activated cancer cells suppress NLRP3 inflammasome activity of macrophages. (A) Representative images of PLA for detecting NLRP3 and ASC interaction in PBMC-derived macrophages incubated with the exosomes from FaDu-Vec/FaDu-Snail. The red dots indicate the PLA signals. Scale bar, 10 µm. Right, quantification of number of PLA signals per cell. For each group, at least a total of 50 cells from six randomly-selected fields were used for PLA quantification. Data represent means±SD. ***p<0.001 by Student’s t-test. (B) ELISA for analyzing the level of secreted IL-1β by PBMC-derived macrophages incubated with exosomes from FaDu-Vec/FaDu-Snail. n=5 independent experiments (each experiment contains two technical replicates). Data represent means±SD. **p<0.01 by Student’s t-test. (C) Left, representative images of PLA for detecting NLRP3 and ASC interaction in PBMC-derived macrophages transduced with miR-21 or a control agomir. The red dots indicate the PLA signals. Scale bar, 10 µm. Right, quantification of number of PLA signals per cell. For each group, at least a total of 60 cells from randomly-selected fields (six for miR-21 group and eight for ctrl group) were used for PLA quantification. Data represent means±SD. ***p<0.001 by Student’s t-test. (D) IL-1β ELISA of PBMC-derived macrophage. miR-21 agomir or a control sequence (Ctrl) was transduced to macrophage. n=5 independent experiments (each experiment contains two technical replicates). Data represent means±SD. **p<0.01 by Student’s t-test. (E) ELISA for analyzing the level of secreted IL-1β by macrophages derived from wild-type THP1 (THP1-WT) or MIR21-knockout THP1 (THP1MIR21–/–). The macrophages were treated with/without LPS (1 µg/mL) and nigericin (5 µM). n=6 (each contains two technical replicates) for each group. Data represent means±SD. ***p<0.001 by Student’s t-test. (F) Representative images of PLA for detecting NLRP3 and ASC interaction in THP1-WT/THP1MIR21–/–-derived activated macrophages. The red dots indicate the PLA signals. Scale bar, 10 µm. Right, quantification of number of PLA signals per cell. For each group, at least a total of 400 cells from five randomly selected fields were used for PLA quantification. Data represent means±SD. ***p<0.001 by Student’s t-test. (G) Representative images of PLA for detecting NLRP3 and ASC interaction in THP1MIR21–/–-derived macrophages incubated with exosomes from FaDu cells transfected with miR-21-expressing vector (FaDu-miR21) or a control vector (FaDu-Ctrl). The red dots indicate the PLA signals. Scale bar, 10 µm. For each group, at least a total of 400 cells from five randomly selected fields were used for PLA quantification. Data represent means±SD. ***p<0.001 by Student’s t-test. (H) ELISA for analyzing the level of secreted IL-1β by THP1-derived macrophages. The macrophages were treated with/without LPS (1 µg/mL) and nigericin (5 µM) and the exosomes from FaDu cells transfected with a control vector (FaDu-ctrl), Snail-expressing vector (FaDu-Snail), Snail and anti-miR-21 (FaDu-Snail-anti-miR-21). n=3 (each contains two technical replicates) for each group. Data represent means±SD. **p<0.01, ***p<0.001 by Student’s t-test. (I) Representative images of PLA for detecting NLRP3 and ASC interaction in THP1MIR21–/–-derived activated macrophages incubated with exosomes from FaDu cells transfected with a control vector, a miR-21-expressing vector, or Snail together with an antagomir for miR-21 (Snail-anti-miR21). The red dots indicate the PLA signals. Scale bar, 10 µm. For each group, at least a total of 400 cells from five randomly selected fields were used for PLA quantification. Data represent means±SD. **p<0.01, ***p<0.001 by Student’s t-test. IL, interleukin; miR, micro RNA; PBMC, peripheral blood monoclear cells; PLA, proximity ligation assay.

