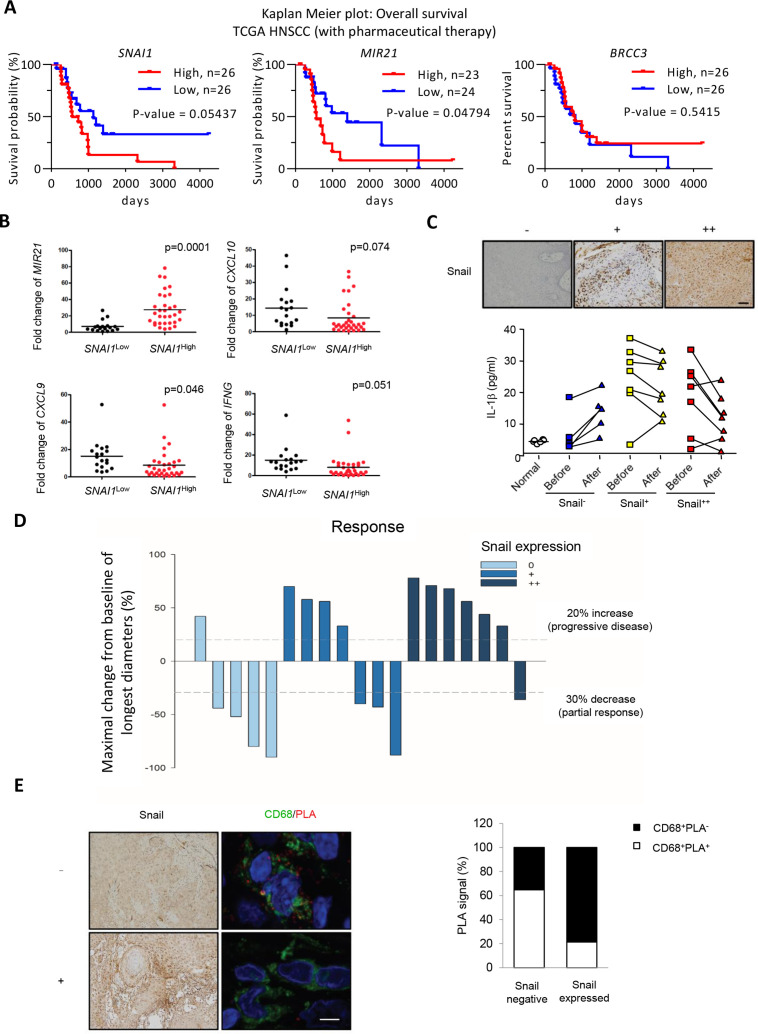
Figure 7.
Snail limits chemotherapy-induced NLRP3 inflammasome activation in patients with HNSCC. (A) Kaplan-Meier plots for analyzing the influence of differential expression of SNAI1, MIR21, and BRCC3 on overall survival of patients with HNSCC with pharmaceutical therapy from TCGA database. The log-rank p value is shown in each panel. (B) Quantitative real-time PCR for analyzing the expression level of MIR21, CXCL10, IFNG and SNAI1 in HNSCC samples. n=50. The SNAI1High (n=32) is defined as the level higher than mean value, and the SNAI1Low (n=18) is defined as the level lower than mean value. (C) Upper, IHC staining of Snail with differential expressions in representative HNSCC samples. Scale bar, 50 µm. Lower, serum IL-1β level in patient with HNSCC before and 1 day after chemotherapy. (D) A waterfall plot for illustrating the response to chemotherapy of patients with HNSCC in (C). (E) Left, IHC staining of Snail (left) and immunofluorescent staining (right) of CD68 (green)/NLRP3-ASC PLA (red) in representative HNSCC samples. Right, quantification of the results. Three Snail-negative and two Snail-positive HNSCC samples were used in the experiment. For each sample, at least five CD68+ TAMs were quantified for PLA signals. The result is shown as the percentage of PLA-positive among CD68+ TAMs. Scale bar, 5 µm. HNSCC, head and neck squamous cell carcinoma; IHC, immunohistochemistry; PLA, proximity ligation assay; TAM, tumor-associated macrophages; TCGA, The Cancer Genome Atlas.

