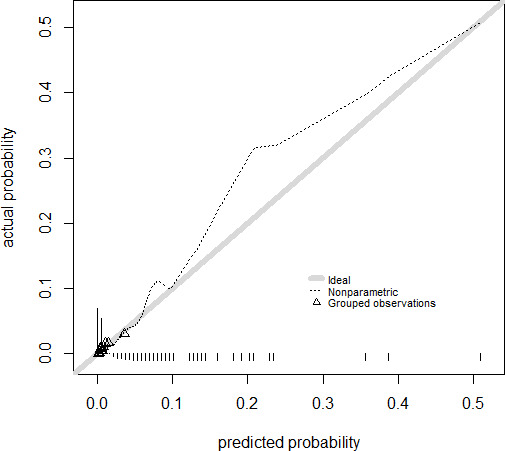
Figure 3.

Calibration plot with the actual probability against the predicted probability for the model for surgical site infection. The triangles indicate quantiles (g=10) of patients with a similar predicted probability of success. The grey diagonal line represents perfect agreement between predicted and actual probability.
