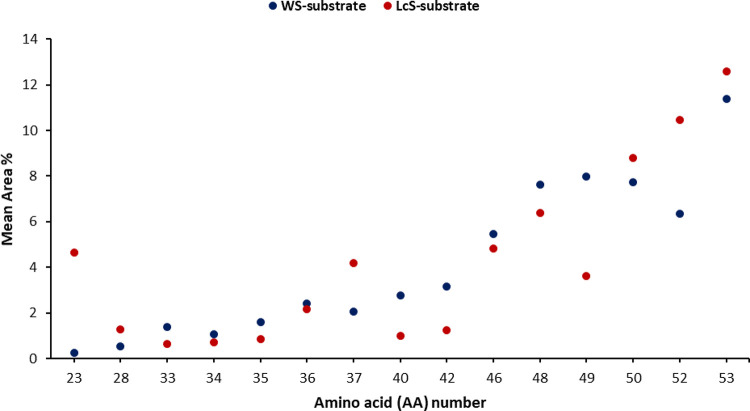
Figure 1.
Normalized distribution (area values) of the most differentially expressed amino acid based on the comparison between the two growth substrates (WS and LcS). Points represent P. ostreatus strains grown on the respective substrate and are reported as mean values (n = 6). The corresponding number for each amino acid is defined in Table 1.

