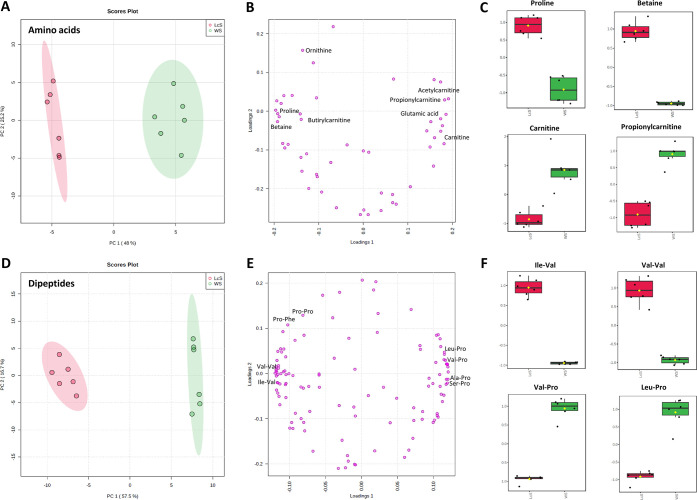
Figure 3.
Principal component analysis (PCA) (A) score plot and (B) loading plot visualization using 53 identified amino acids; (C) boxplot of representative, significantly different, amino acids grown on the WS or LcS substrate; PCA (D) score plot and (E) loading plot visualization using 119 identified dipeptides; and (F) boxplot of representative, significantly different, dipeptides grown on the WS or LcS substrate.

