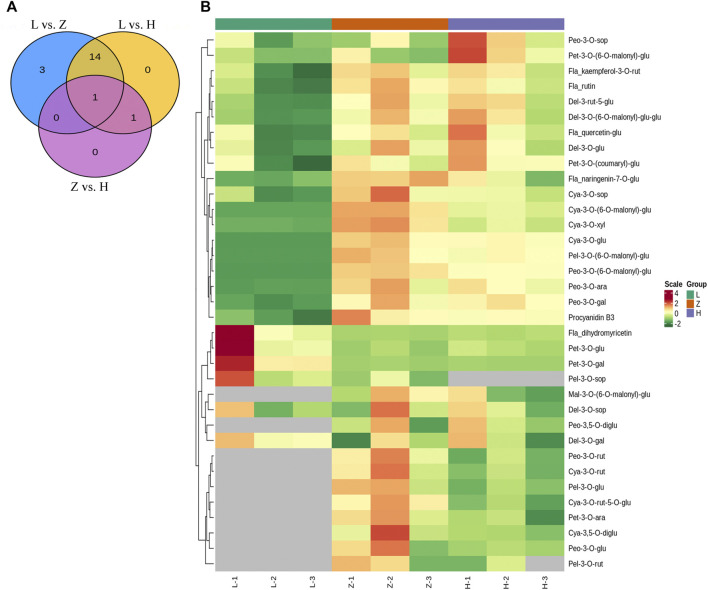
FIGURE 3.
Anthocyanin profile. (A) venn diagram depicting differentially accumulated anthocyanins in each group with overlap, where L, H, and Z correspond to green, yellow, and purple leaves, respectively. (B) heatmap depicting accumulation pattern of identified anthocyanins in green, yellow, and purple leaf tissues. The numbers 1, 2, and 3 correspond to each replication.

