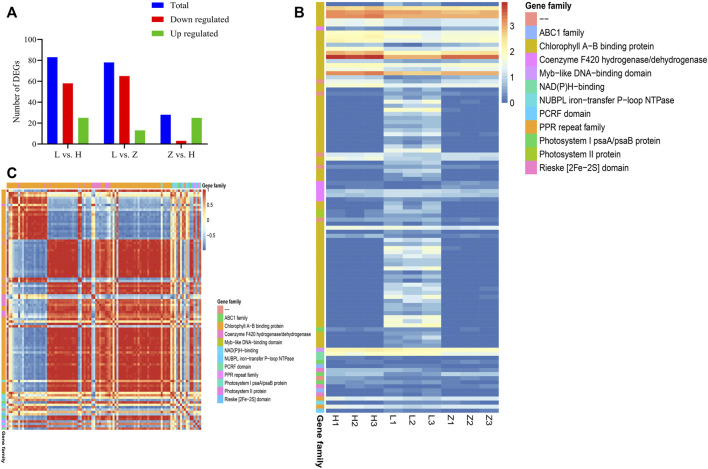
FIGURE 7.
Characterization of DEGs associated with the chlorophyll contents. (A) statistics for chlorophyll-related DEGs in three comparisons between green, yellow, and purple leaves, viz., L vs. H, L vs. Z, and Z vs. H. (B) heatmap of 151 chlorophyll-related DEGs based on corresponding FPKM values. (C) correlation plot representing PCC between 101 chlorophyll-related DEGs.

