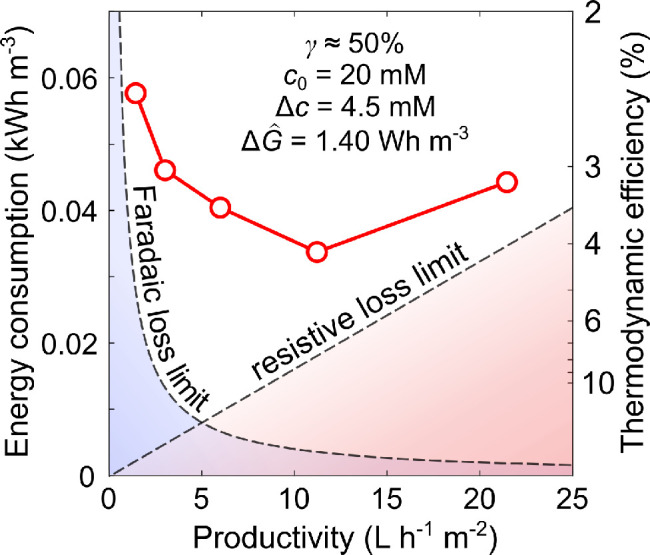
Figure 41.

Graphical explanation of the relationship between productivity, energy consumption, and thermodynamic efficiency. Values were obtained by interpolation of data from 30 CDI experiments reported in ref (1171). In this plot, water recovery (γ), feed concentration (c0), and average reduction in concentration (Δc) are prescribed. The dashed straight line and dashed curved line show qualitative lower limits imposed by resistive and Faradaic losses, respectively.
