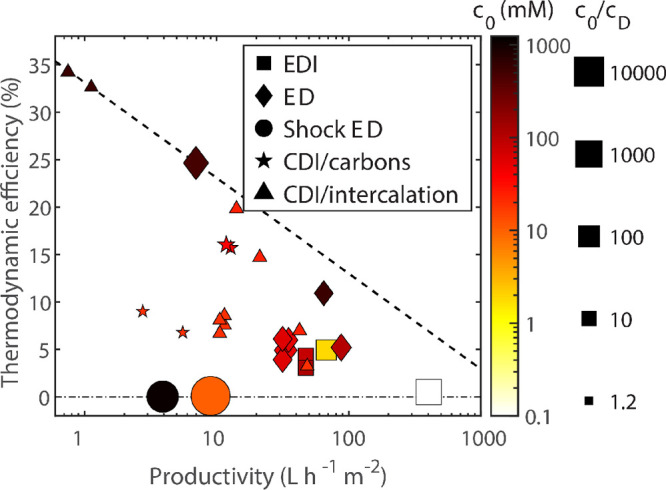
Figure 42.

Thermodynamic energy
efficiency as a function of productivity for
various electrochemical methods performing laboratory-scale desalination
of brackish and dilute water. Representative data are presented for
EDI (squares),623,1184,1185 ED (diamonds),342,1186−1189 shock ED (circles),87,584 and CDI with either carbon electrodes
(stars)636,757 or intercalation electrodes (triangles).715,907,937 The color and size of each data
marker represent feed concentration and the ratio c0/cD (see eq 19), respectively. The dashed line
represents an (approximate) empirical efficiency limit and is given
by  , where
  is in units of L h–1 m–2.
