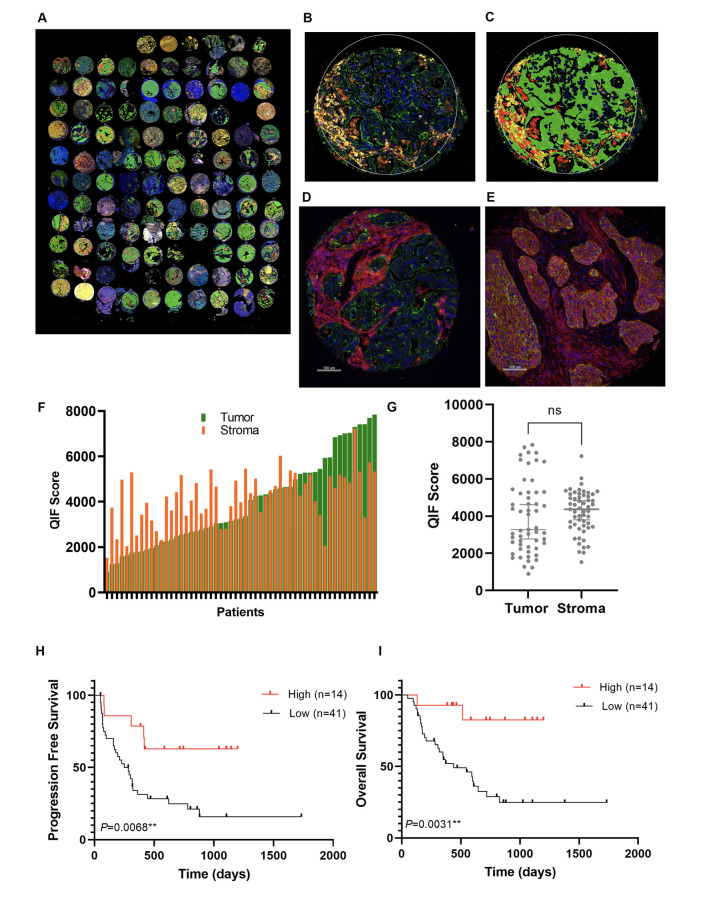
Figure 1.
Identification of CD44 expression in the tumor compartment as a predictor of survival in YTMA471 discovery cohort. (A) Representative image of YTMA471 acquired using the GeoMx DSP system. (B–C) Representative TMA spot showing the fluorescence image (B) and the compartmentalized image created by fluorescence colocalization (C) using the GeoMx DSP system; panCK (green), CD45 (yellow), CD68 (red), SYTO13 (blue). (D–E) Representative TMA spot of low CD44 expression in panCK +tumor cells (D) and high CD44 expression in panCK +tumor cells (E) using QIF; panCK (green), CD44 (red), DAPI (blue). (F) Dynamic range of CD44 expression in the tumor compartment (panCK+) and in the stromal compartment (panCK–) using QIF. (G) Comparative analysis of CD44 levels measured by QIF in the tumor compartment and the stromal compartment. (H–I) Kaplan-Meier PFS curve (H) and OS curve (I) according to CD44 expression in the tumor compartment using QIF (optimal quartile cutpoint). CK, cytokeratin; DSP, digital spatial profiling; ns, not significant; OS, overall survival; PFS, progression-free survival; QIF, quantitative immunofluorescence; TMA, tissue microarray.

