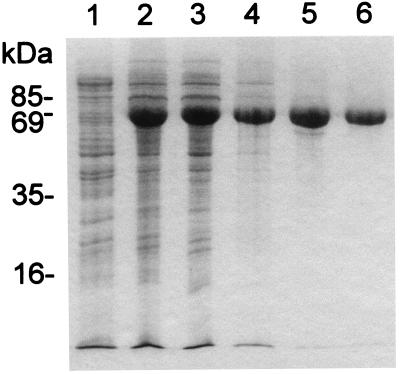
FIG. 1.
Purification of protein P2. Samples were taken at different purification stages and analyzed by SDS-PAGE, and the gels were stained with Coomassie blue. Lanes: 1, disrupted HMS174(pMG59) cells prior to induction; 2, disrupted cells after induction; 3, cleared supernatant after ultracentrifugation; 4, pooled fractions after chromatography on Resource Q; 5, P2-containing fractions after phenyl-Superose chromatography; 6, purified P2 after gel filtration. The values on the left indicate the molecular masses of several marker proteins.

