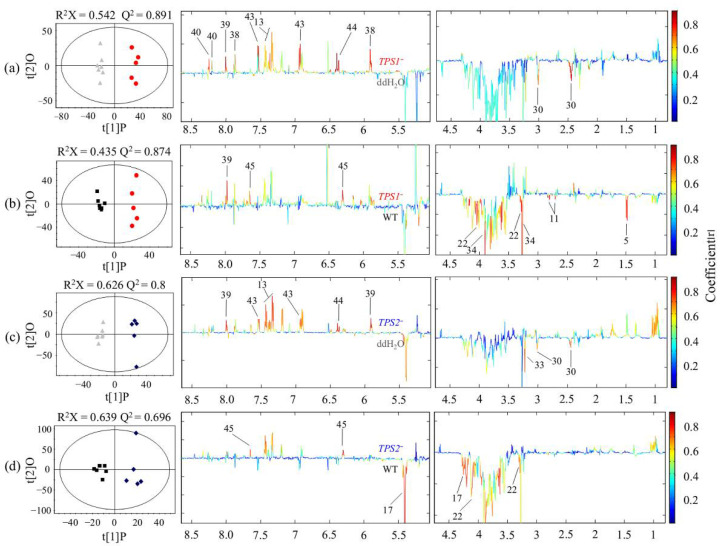
Figure 3.
OPLS-DA scores plots (left) and coefficient-coded loadings plots (right) showing metabolic differences of FHB-resistant wheat Sumai 3 inoculated with (a) TPS1− (red) vs. ddH2O (grey) (CV-ANOVA p = 0.0018), (b) TPS1− (red) vs. WT (black) (CV-ANOVA p = 0.0029), (c) TPS2− (blue) vs. ddH2O (grey) (CV-ANOVA p = 0.014), and (d) TPS2− (blue) vs. WT (black) (CV-ANOVA p = 0.01). Metabolite keys are the same as in Figure 1 and Table S1.

