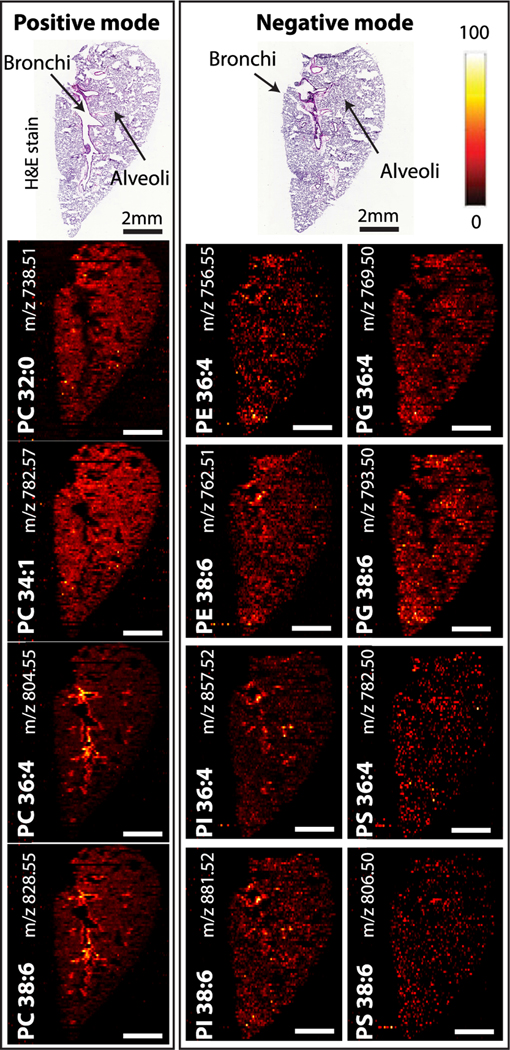
Figure 3.
Selected ion images acquired over the lung tissue section of phospholipids from both positive and negative ionization modes using shear force microscopy nano-DESI MSI. H&E stained image of a mouse lung tissue section and the ion maps of sodiated PCs detected in the positive ionization mode. The localization of selected PE, PG, PI, and PS containing polyunsaturated fatty acids identified by the negative mode. Scale bars are 2 mm. Intensity scale bar (red hot) ranges from 0% (black) to 100% (white) signal intensity of an individual peak.

