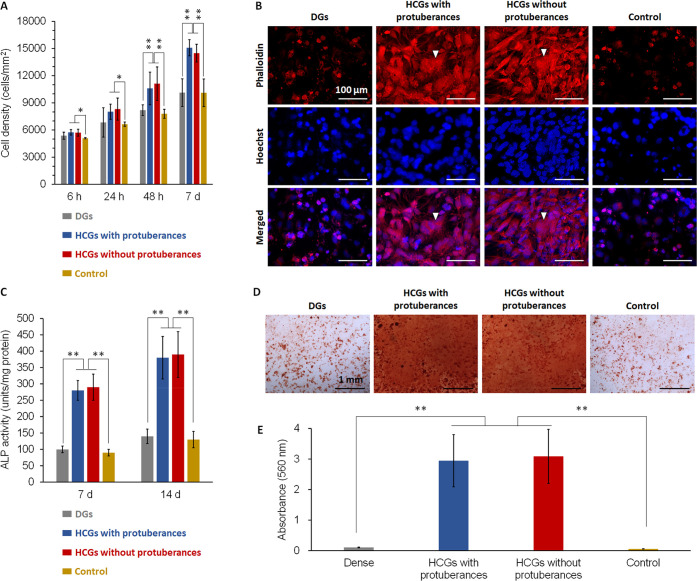
Figure 6.
(A) Cell proliferation assays during a culture period of 7 d. (B) Fluorescent images after 7 d of culture (scale bar = 100 μm). Cellular F-actin and nuclei were stained with phalloidin and Hoechst 33258, respectively. (C) ALP activities after 7 and 14 d of culture. (D) Optical images of cultures stained with Alizarin Red S after 21 d of culture (scale bar = 1 mm). (E) Absorbance of alizarin extracts for quantification of mineral nodule formation. *p < 0.05 and **p < 0.01

