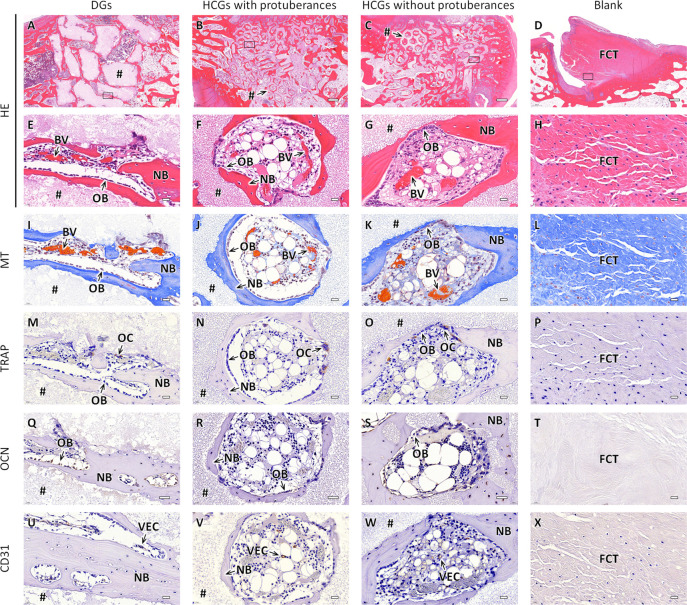
Figure 8.
Histological sections of the DG- and HCG implanted groups with and without protuberances and blank group at 4 weeks after surgery. (A–H) HE, (G–L) MT, (M–R) TRAP, (M–R) OCN, and (U–X) CD31-stained sections. Panels E–X showed magnified images of the regions corresponding to the regions enclosed by squares in panels A–D. NB, BV, OB, OC, VEC, FCT, and “#” indicate new bone, blood vessel, osteoblast, osteoclast, vascular endothelial cell, fibroconnective tissue, and remaining scaffold, respectively. Scale bars: 500 μm (A–D) and 20 μm (E–X).

