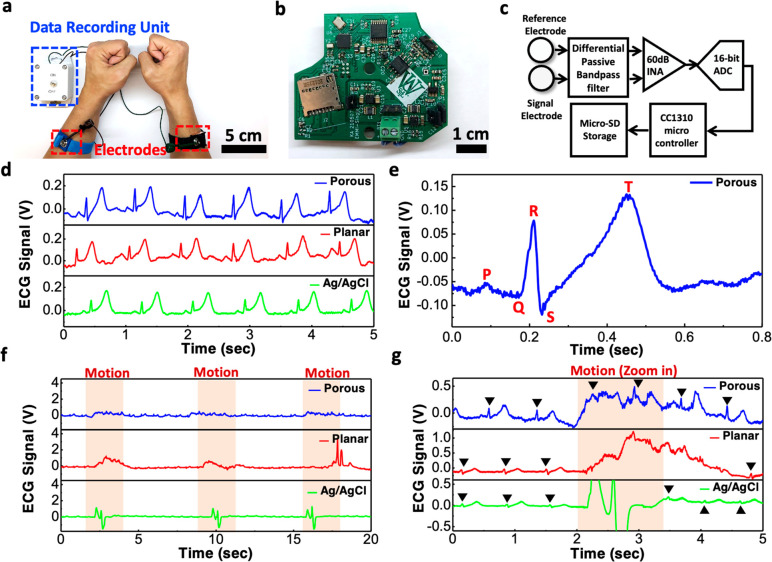
Figure 3.
ECG recording and the effect of motion artifacts. (a) Photograph showing the ECG recording setup. (b) Photograph showing the PCB board of our in-house built biopotential data recorder. (c) Block diagram of the portable data recording unit. (d) ECG signals measured using the porous PEDOT:PSS/PDMS electrode, planar PEDOT:PSS electrode, and commercial Ag/AgCl electrode. (e) Representative cycle of the ECG waveform acquired by the sponge electrode showing clear P wave, QRS complex, and T wave. (f) ECG signals measured under the presence of motion artifacts caused by periodic body movement. (g) Zoomed-in view of the data in (f) showing the ECG peaks along with the motion artifacts.

