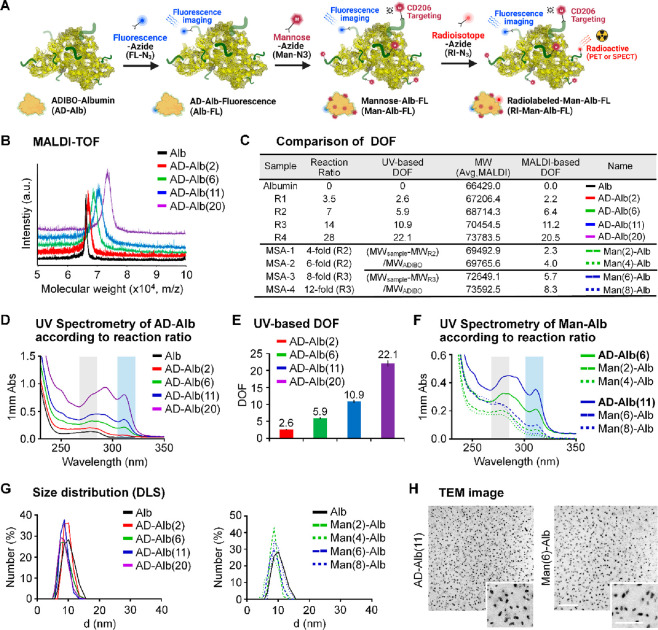
Figure 1.
Construction and characterization of MSA. (A) Schematic representation of MSAs using click reaction in AD-Alb with other functional molecules. (B) MALDI-TOF data of AD-Alb according to the reaction ratio. (C) Comparison of DOF on each albumin sample using UV-based analysis and MALDI-TOF-based calculation. (D) UV spectrum of the same albumin sample used in MALDI-TOF measurement of AD-Albs. (E) UV-based calculated data of each type of AD-Albs. (F) UV-spectrum of Man-Alb and AD-Alb according to reaction ratio. (G) Size data of all AD-Alb and Man-Alb using DLS after averaging five measurements. (H) TEM image analysis using selected samples to be used for in vitro and in vivo experiments. Scale bar = 500 nm; 250 nm for the magnified images.

