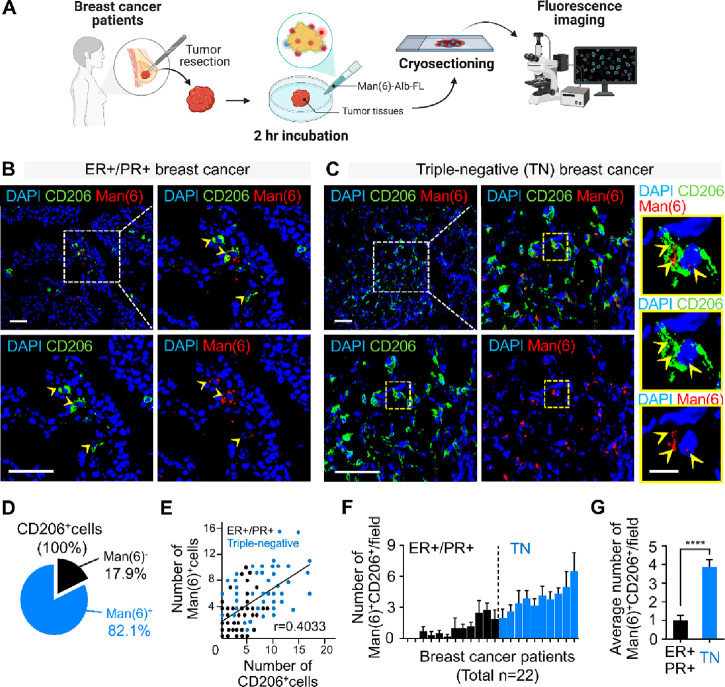
Figure 7.
Fluorescence imaging of human breast cancer tissues with Man(6)-Alb-FL. (A) Illustration of fluorescence imaging of Man(6)-Alb-FL in resected tumor tissues from breast cancer patients. (B,C) Representative confocal immunofluorescent images of CD206 (green), Man(6)-Alb-FL (red), and DAPI (nucleus, blue) in ER+/PR+ (n = 12) (B) and triple-negative (TN) (n = 10) (B) human breast tumor sections 2 h after Man(6)-Alb-FL administration. Yellow arrowheads indicate Man(6)-Alb-FL-loaded CD206+ cells (B). Higher magnification images of the yellow-outlined area also show Man(6)-Alb-FL uptake in CD206+ cells (yellow arrowheads) in a triple-negative breast tumor section (C). Scale bar = 50 μm for images in (B) and (C), and 10 μm for the yellow magnified images in (C). (D) Pie chart indicating the percentage of Man(6)-Alb-FL uptake by CD206+ cells in human breast tumor sections. (E) Correlation analysis of CD206+ cells and Man(6)-Alb-FL-positive cells (Man(6)+ cells) in human breast tumor sections. Black and blue dots indicate ER+/PR+ (n = 12) and triple-negative (TN) (n = 10) breast tumor sections, respectively. (F) The number of Man(6)-Alb-FL-positive (Man(6)+) CD206+ cells in ER+/PR+ (n = 12, black) and triple-negative (TN) (n = 10, blue) human breast tumor sections. (G) The average number of Man(6)+CD206+ cells in ER+/PR+ and TN human breast tumor sections. For quantification, 3–6 nonoverlapping images per section were counted. Data show means ± SEM. ****P < 0.0001 using Student’s t-test.

