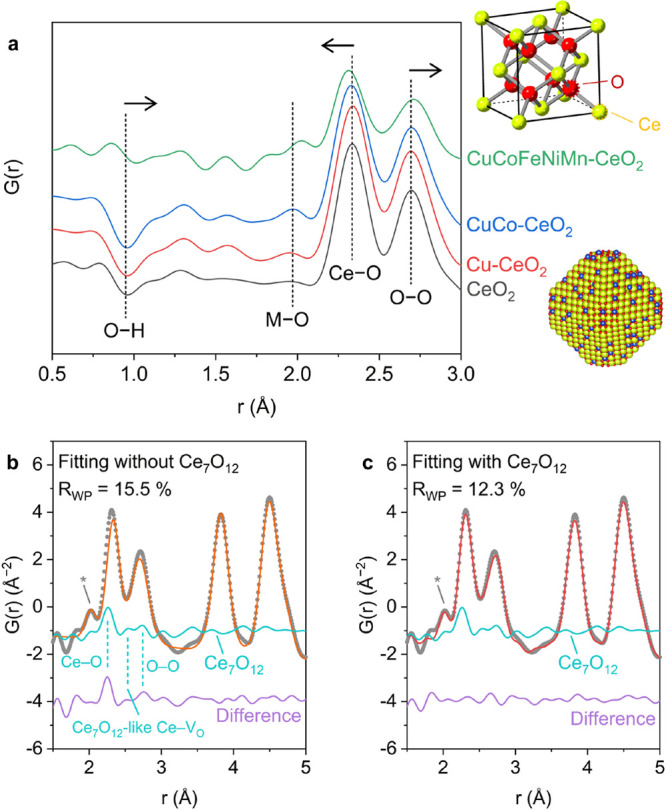
Figure 3.

(a) Short-range neutron diffraction data for the transition-metal-substituted CeO2 samples. The peaks corresponding to the O–H, M–O, Ce–O, and O–O correlations are noted for comparison. Insets showing the structure model of the fluorite structure of CeO2 and illustrative model of the surface-substituted CeO2 nanocrystals are provided at the top and bottom, respectively. Short-range PDF analysis of CuCoFeNiMn-CeO2 (b) excluding and (c) including the Ce7O12 phase. The contribution from the rock salt HEO domains, which is less than 5 Å as shown in Figure S21, is highlighted using an asterisk.
