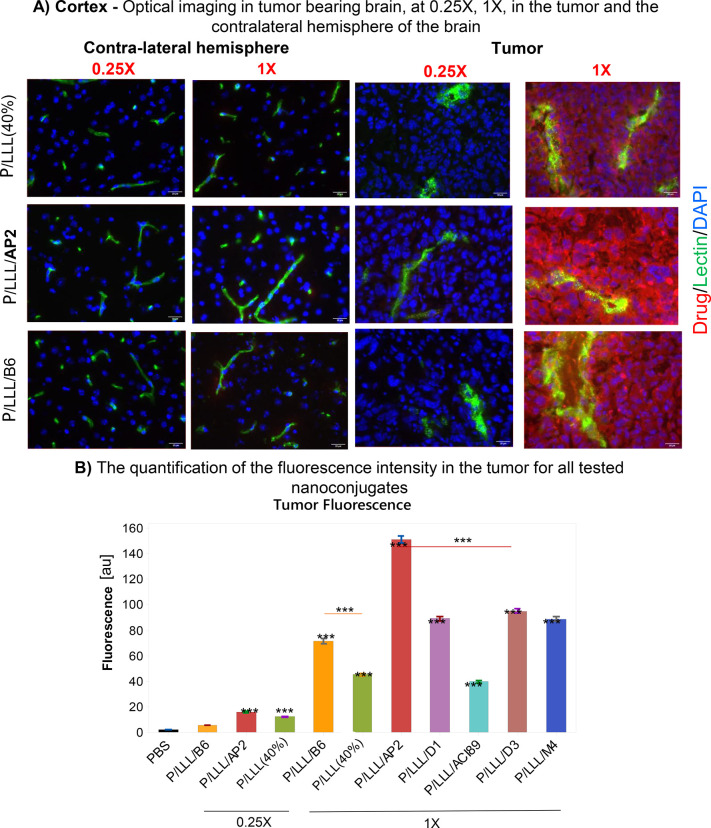
Figure 2.
BBB-permeation in brain tumor: Imaging and tumor permeation analysis in a mouse model of glioblastoma. Female BL/6 Mice (n = 3) were inoculated intracranially with glioblastoma cell line GL261 at 8 weeks of age and measured 3 weeks after inoculation. A comparison of the permeability of P/LLL(40%), P/LLLAP2, P/LLLB6, P/LLL/D1, P/LLL/AC189, P/LLL/D3, and P/LLL/M4 in tumor and nontumor tissue from the contralateral brain hemisphere was carried out. (A) Representative optical imaging data showing nanoconjugate permeation into the tumor (right) and in the cerebral cortex of the contralateral hemisphere in the same animal (left). Comparison of dose 0.25X (0.068 μmol/kg) and dose 1X (0.274 μmol/kg). Nanoconjugate fluorescence (red), vasculature (green), and cell nuclei (blue) are shown. (B) Intensity bar-graph for nanoconjugate fluorescence in tumor tissue. Background is shown in black, P/LLL(40%) (0.25X and 1X) in green, P/LLL/B6 (0.25X and 1X) in orange, P/LLL/AP2 (0.25X and 1X) in red, P/LLL/D1 (1X) in violet, P/LLL/ACI89 (1X) in blue, P/LLL/D3 (1X) in brown, and P/LLL/M4 (1X) in dark blue. Average nanoconjugate fluorescence measurements were obtained from 20 randomly sampled ROIs outside of the cerebral vasculature (n = 3 with 5 images acquired in each tumor and nontumor tissue sample). All statistical tests were conducted by one-way ANOVA with Tukey t tests. Significance is indicated with asterisks where * = p < 0.01, ** = p < 0.001, and *** = p < 0.0001. Error bars represent SEM.

